- Polkadot price printing a bearish engulfing on the 3-day chart.
- DOT price has ramping volume pattern signaling bearish control.
- Invalidation of the bearish downtrend is a breach at $14.50.
Polkadot price could continue the steep decline, and a short opportunity could present itself, but the technicals need more time to establish a clear entry.
Polkadot price is impulsively headed south.
Polkadot price, like most cryptocurrencies in the space, is under considerable bearish pressure. Today, the bears are moments away from printing a bearish engulfing candlestick on the 3-day chart. Such a bearish presence warrants the idea of additional drops. Analyzing the technicals, there could be significant liquidity at the $6.90 level for market makers to aim for next.
Polkadot price also displays bearish confluence on the volume profile indicator. The bears have established a classic ramping pattern in which professional traders claim to forecast moves in advance. Thus, an additional price drop will likely occur, but at the current time, forecasting an imminent bottom will need more chart evidence.
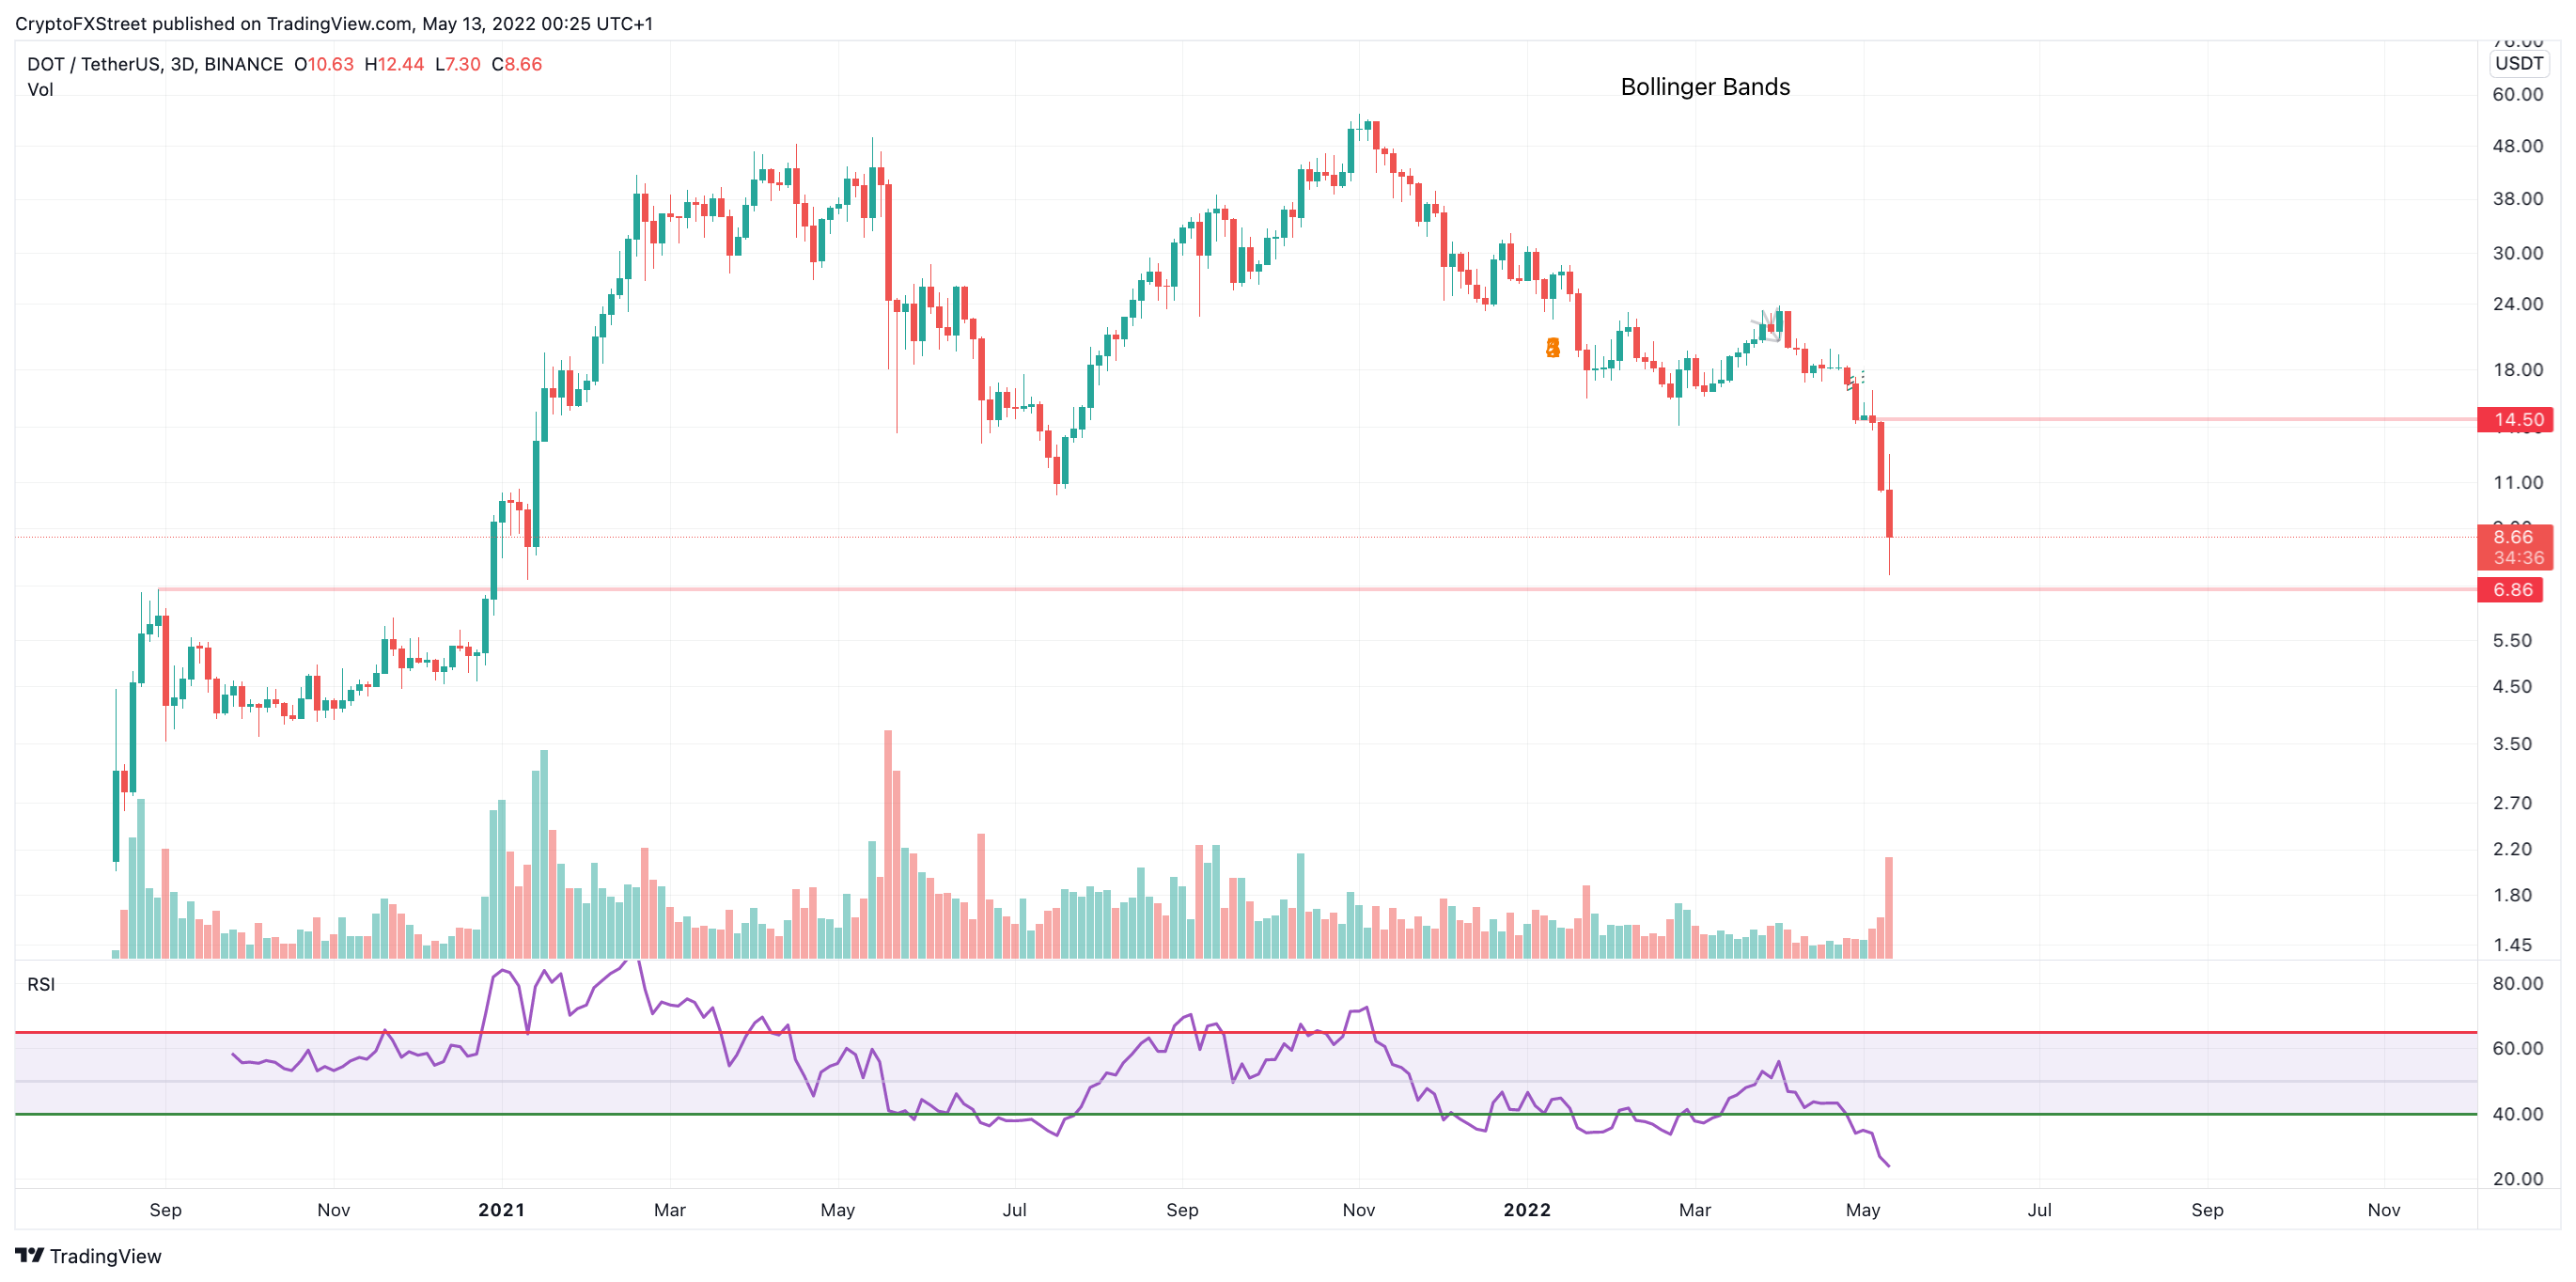
DOT/USDT 3-Day Chart
Invalidation of the bearish downtrend is a breach at $14.50. If the bulls can establish a price spike at this level, the entire downtrend could halt. The bulls could then reclaim the $ 16 price level resulting in a 100% increase from the current Polkadot price.
Information on these pages contains forward-looking statements that involve risks and uncertainties. Markets and instruments profiled on this page are for informational purposes only and should not in any way come across as a recommendation to buy or sell in these assets. You should do your own thorough research before making any investment decisions. FXStreet does not in any way guarantee that this information is free from mistakes, errors, or material misstatements. It also does not guarantee that this information is of a timely nature. Investing in Open Markets involves a great deal of risk, including the loss of all or a portion of your investment, as well as emotional distress. All risks, losses and costs associated with investing, including total loss of principal, are your responsibility. The views and opinions expressed in this article are those of the authors and do not necessarily reflect the official policy or position of FXStreet nor its advertisers. The author will not be held responsible for information that is found at the end of links posted on this page.
Recommended Content
Editors’ Picks

Ripple Price Prediction: Whale accumulation sparks hope as rising exchange reserves signal caution
XRP sustains mid-week recovery as XRP/BTC flashes golden cross for the first time since 2017. Large volume holders increase XRP exposure, indicating rising demand and investor confidence.

Pi Network Price Forecast: PI eyes $0.66 as whale activity surges
Pi Network (PI) declines by nearly 4% on Friday, trading at $0.79 at press time. The technical outlook suggests a downward move ahead as the short-term recovery concludes with a trendline breakdown.

Bitcoin Weekly Forecast: BTC enters full price-discovery mode after seven straight weeks of gains
Bitcoin price stabilizes around $111,000 on Friday after reaching a new all-time high of $111,900 this week. Corporate accumulation, institutional demand, signs of easing regulations and fiscal woes in the US have fueled BTC’s rally.

Jupiter Price Forecast: JUP eyes $0.82 as Fluid backs Jupiter's upcoming lending protocol
Jupiter exchanges announced the upcoming launch of Jupiter Lend, powered by Fluid, on Solana this summer. With the announcement of Jupiter Lend, the JUP token surged 16% in the last 24 hours.

Bitcoin: BTC stabilizes near $103,000 amid trade optimism, rising institutional demand
Bitcoin (BTC) price stabilizes at around $103,000 when writing on Friday, after facing multiple rejections at the key $105,000 resistance level throughout the week.