Polkadot price develops support to return to $30
- Polkadot price is developing a bullish reversal candlestick on the weekly chart, signaling a bottom is likely in.
- Likewise, the Point and Figure chart displays a bullish reversal setup and a buying opportunity.
- Downside risks remain but are likely limited.

Polkadot price is holding, so far, the $20 value area as its primary support zone. The recent downtrend and sell-off in the cryptocurrency market has positioned DOT in a strong support zone and one that will likely create the bottom it needs to pursue its next uptrend.
Polkadot price readies for another bull run, but only if it holds the $20 value area
Polkadot price is at a vital price range that will likely establish the resumption of a bull run or a dive towards capitulation. Bulls and bears both are nervous because the threshold for rally or collapse continues to decrease. While bears have recently taken control of the trend, there is now a long opportunity available.
A hypothetical long opportunity for Polkadot price now exists on the $2.00/3-box reversal Point and Figure chart. The long setup is a buy stop order at $28, a stop loss at $20, and a profit target at $82. The trade setup is a 6.75:1 reward/risk with an implied profit of 225% from the entry. A three-box trailing stop would help protect any profit made post entry. However, resistance will likely be found immediately at the $30 zone before a run towards $82 could continue.
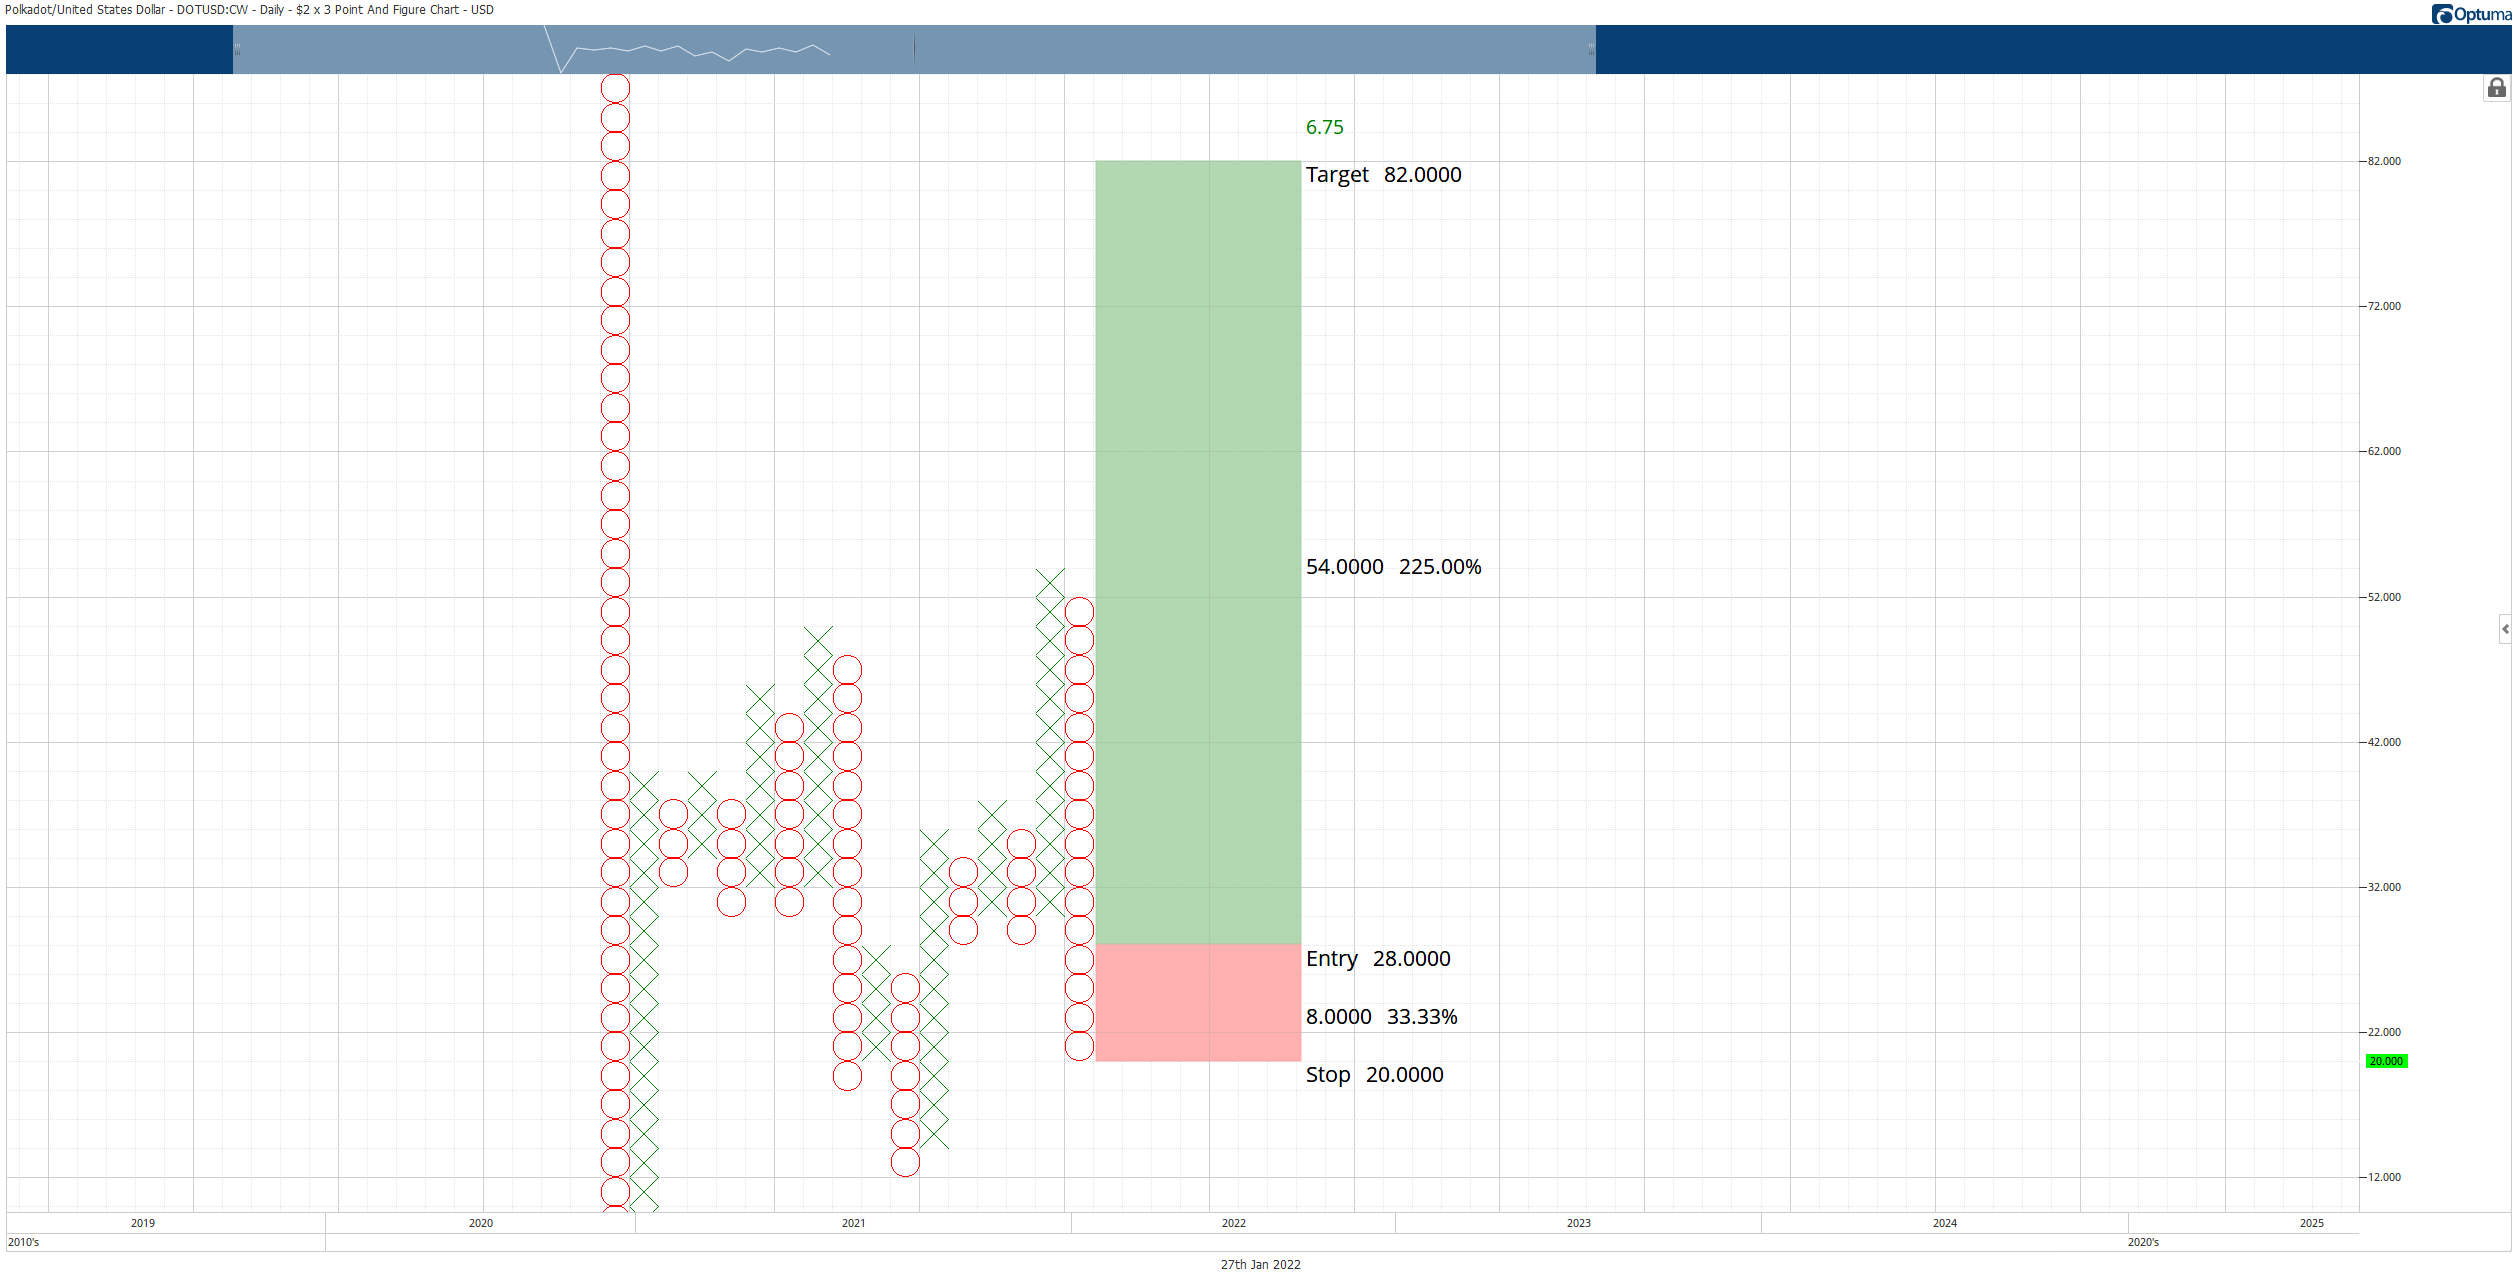
DOT/USD $2.00/3-box Reversal Point and Figure Chart
The $30 value area is the primary resistance level that Polkadot price will need to break before any further upside momentum could occur. The weekly Tenkan-Sen, Kijun-Sen, and 38.2% Fibonacci retracement exist at the $30 price level. So if bulls push above $30, then it’s a wide-open space to push higher.
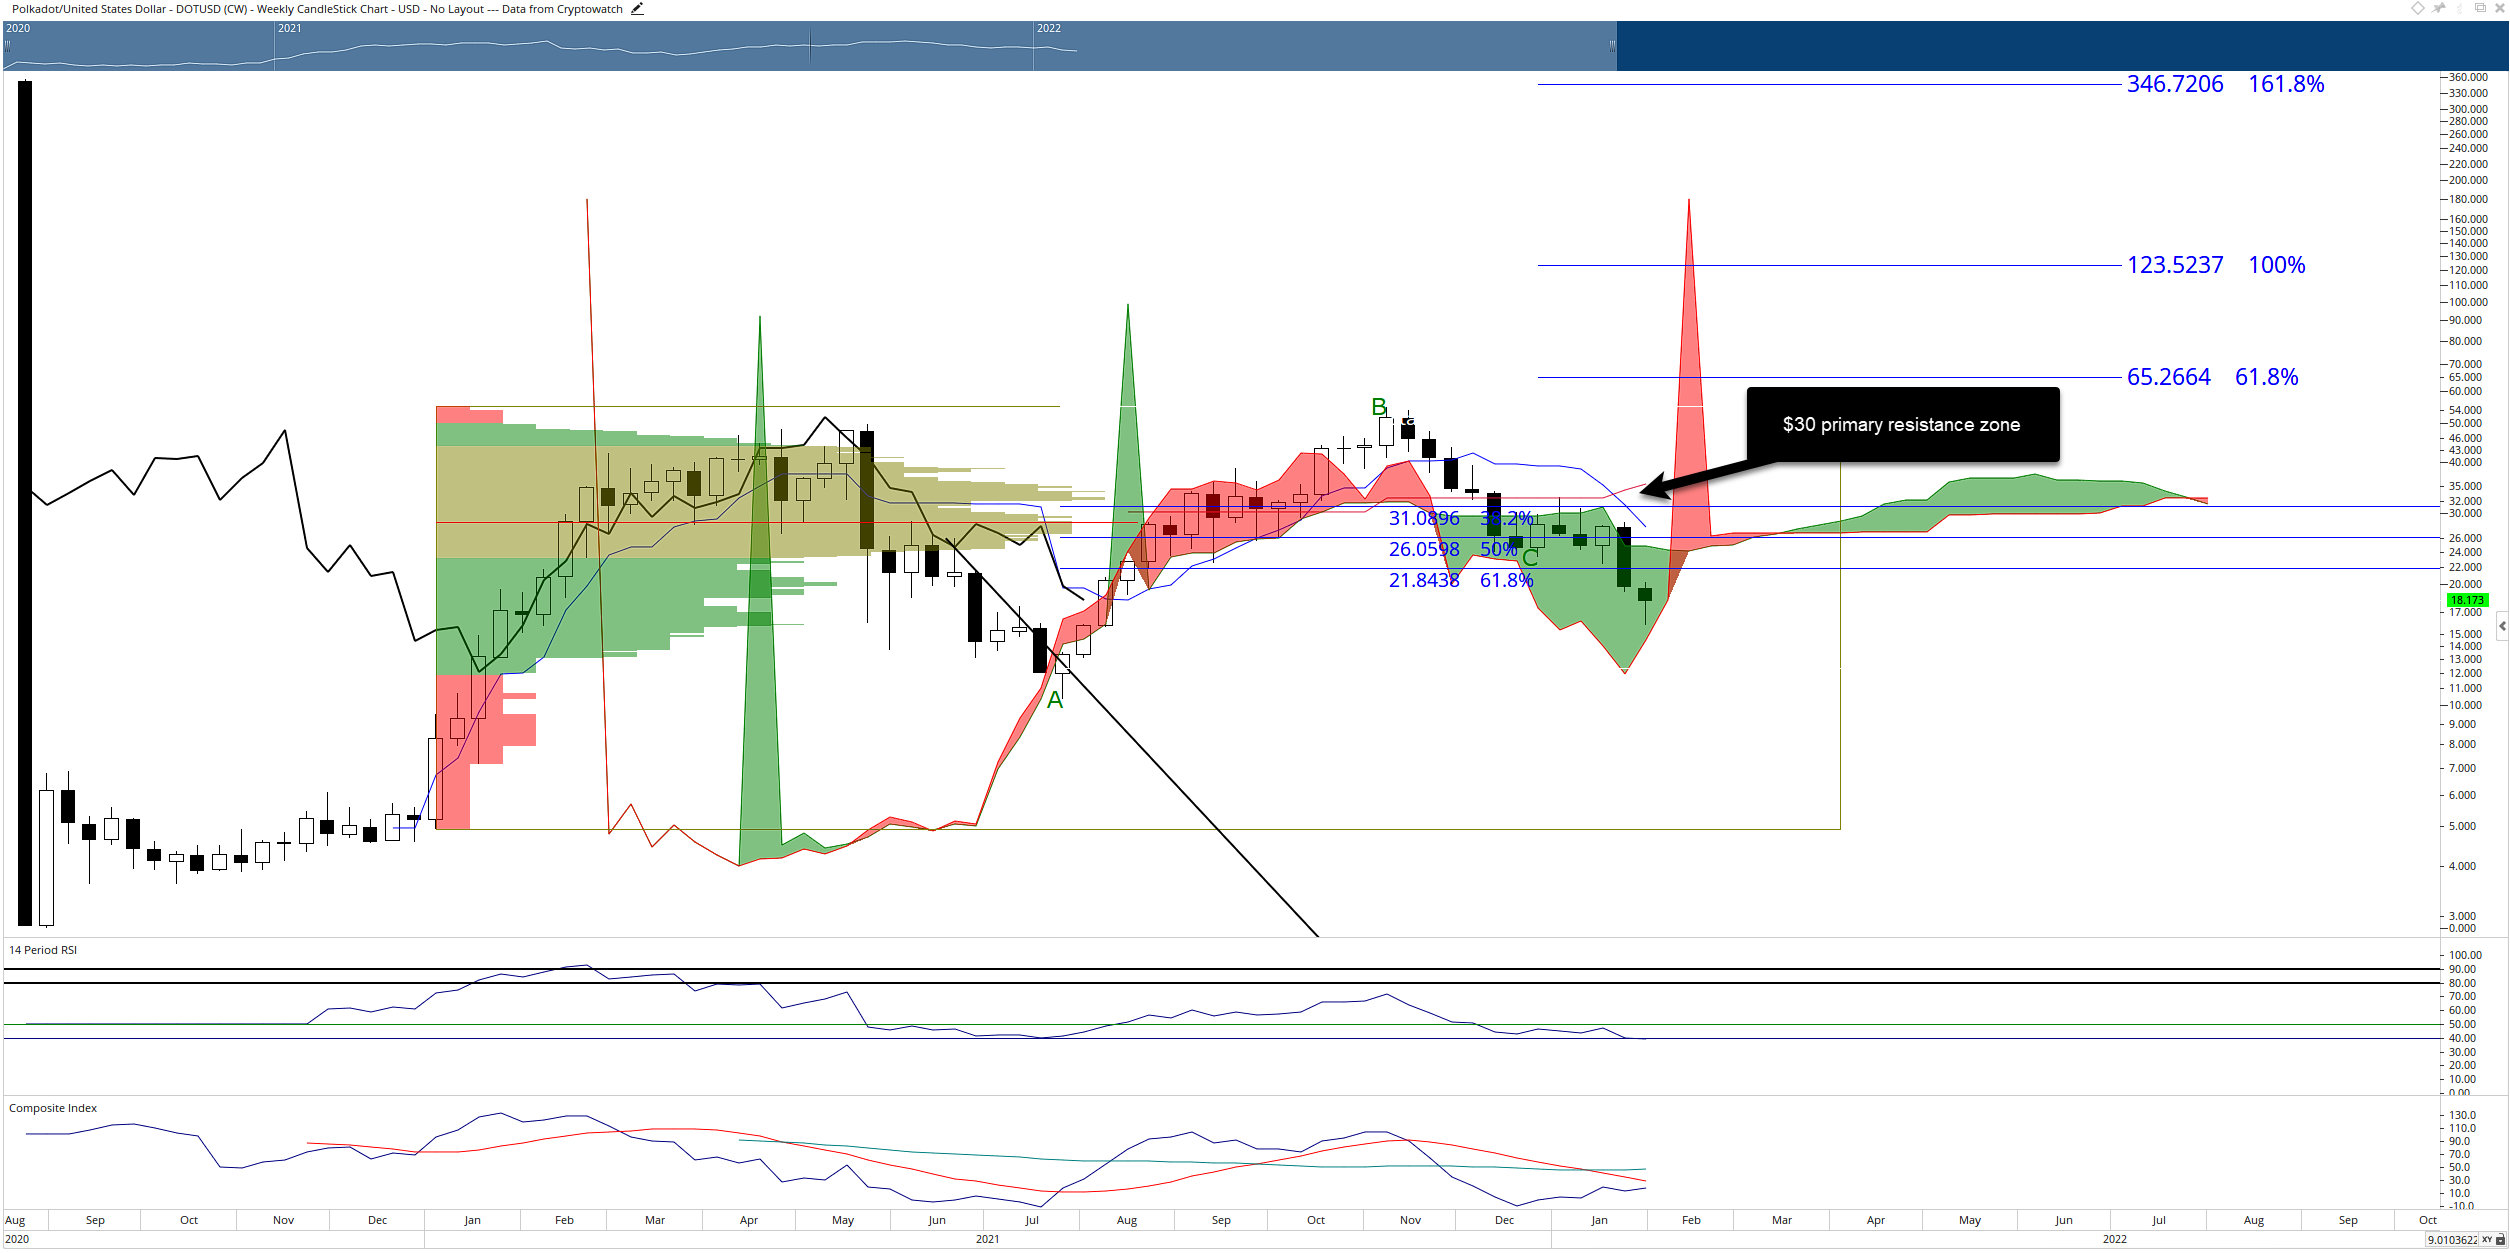
DOT/USD Weekly Ichimoku Kinko Hyo Chart
The bullish outlook for Polkadot price will be invalidated if there is a weekly close below the weekly Ichimoku Cloud at $16. If that occurs, a capitulation move into the single digits is very probable.
Author

Jonathan Morgan
Independent Analyst
Jonathan has been working as an Independent future, forex, and cryptocurrency trader and analyst for 8 years. He also has been writing for the past 5 years.


