Polkadot Price Analysis: Three signs that forecast a 15% decline
- Polkadot price reveals a technical breakdown since Wednesday’s peak.
- DOT primed for another leg lower each time lower support does not hold.
- Expect to see a 15% slide back to the low of March.

Polkadot (DOT) price is on the verge of sinking another 15% while it has already slid 15%. The decline comes after the peak on Wednesday was followed by a technical rejection and a string of breakdowns in support levels. Traders need to monitor this pattern in the coming sessions to time when the bearish powers are outplayed and a bullish upswing re-emerges.
Polkadot price has feeble support levels
Polkadot price peaked near $7.00 on Wednesday before it started to tank quite severely after it got a firm rejection at that level. Price action tanked toward $6.23 where a pivotal level and the 55-day Simple Moving Average (SMA) came in for support. What followed was first a test and a small bounce with the second test breaking substantially below the same support.
DOT sees the same pattern emerging on Friday with a break on the monthly pivot. DOT is bound for a firm break below it as the rebound is losing force quickly. Expect DOT to collapse to $5.74 and next starts to paint a similar pattern again in that area. If that level breaks as well, $5.31 appears to be the last man standing in order to at least halt this sell-off with a full 30% decline from top to bottom.
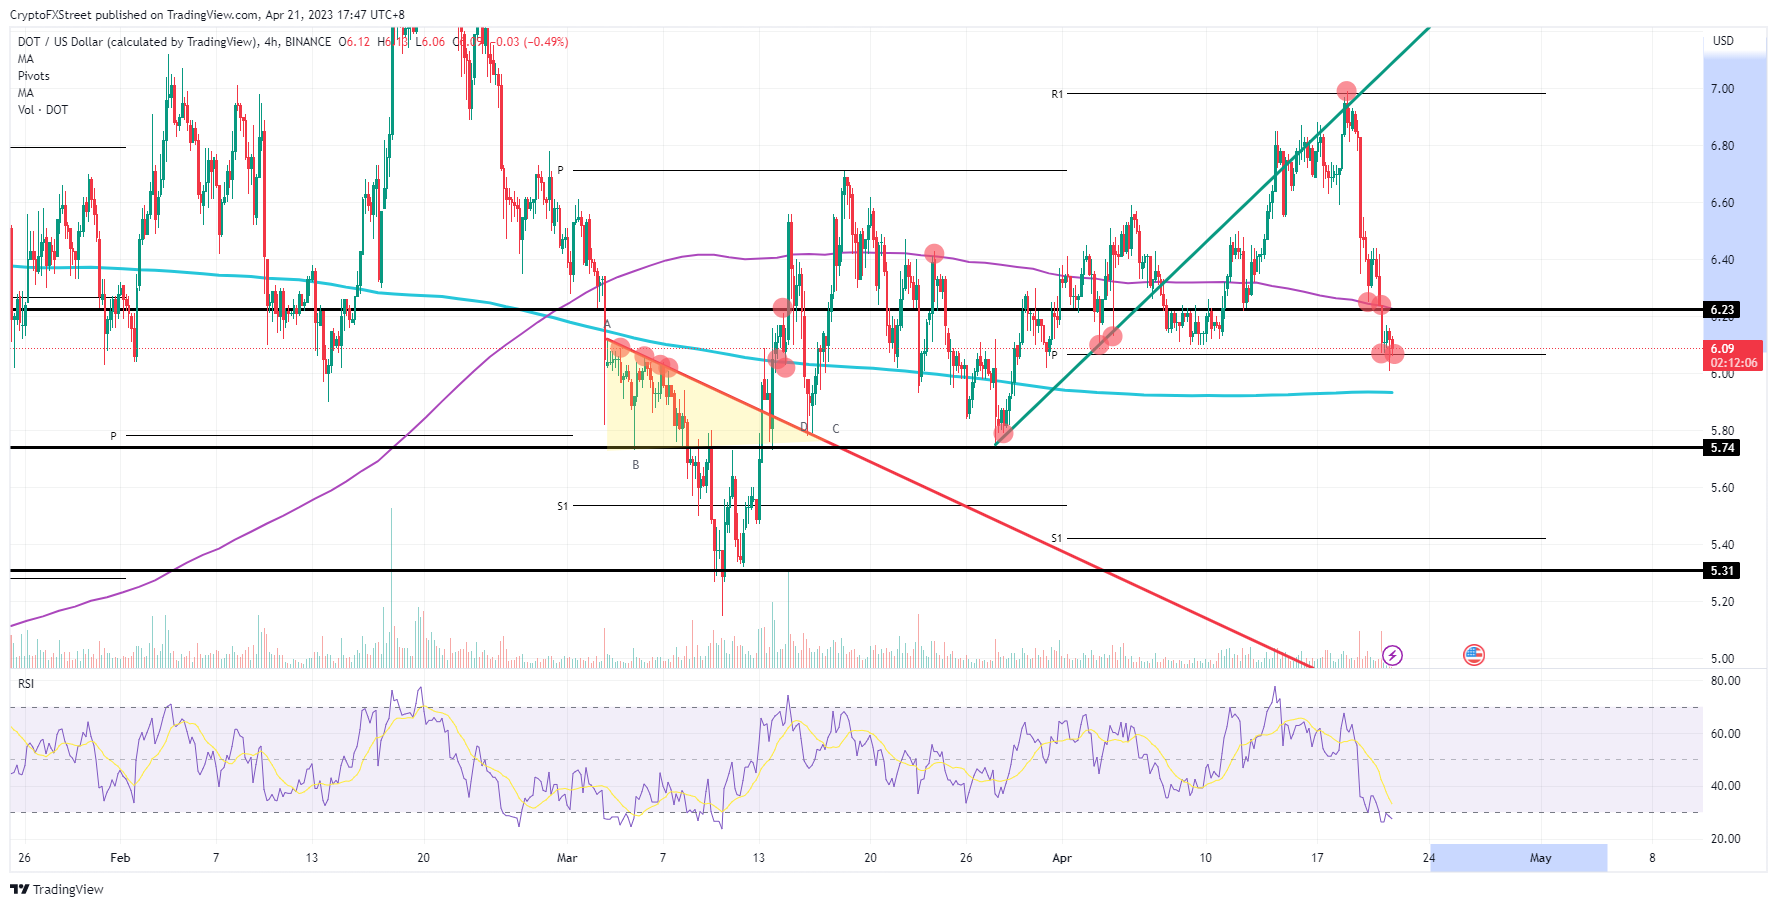
DOT/USD 4H-chart
Just below the monthly pivot, the 200-day SMA can be found and could prove to be the joker for bulls in this sell-off. The Relative Strength Index (RSI) is already firmly oversold and could see bears fading by now with little incentive to push further. A quick pop higher above $6.23 would be a good closing position to end the week.
Author

Filip Lagaart
FXStreet
Filip Lagaart is a former sales/trader with over 15 years of financial markets expertise under its belt.


