Polkadot Elliott Wave technical analysis [Video]
![Polkadot Elliott Wave technical analysis [Video]](https://editorial.fxstreet.com/images/Markets/Currencies/Cryptocurrencies/Polkadot/polkadot-150x150logo-637399979978734311_XtraLarge.png)
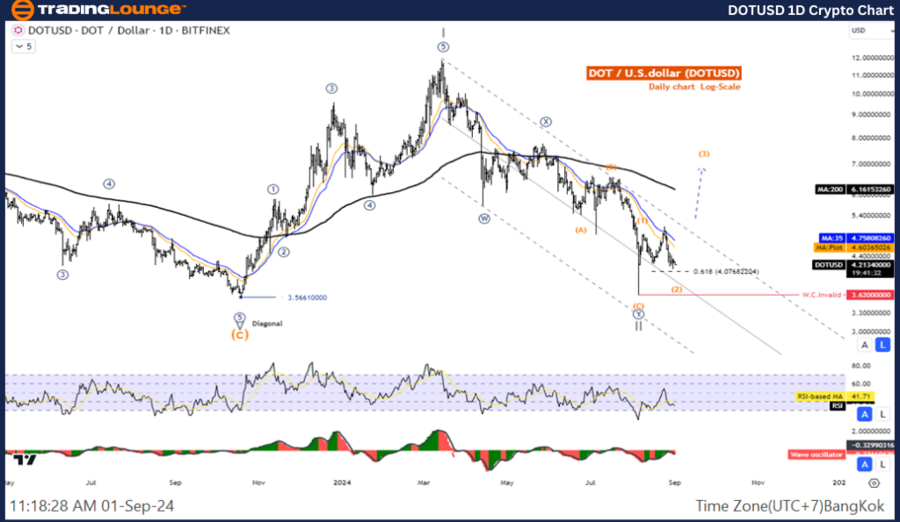
DOT/USD Elliott Wave technical analysis
Function: Counter Trend.
Mode: Corrective.
Structure: Double Corrective.
Position: Wave ((Y)).
Direction next higher degrees: Wave II.
Details: The decline of wave Y is likely to end and the price is re-entering the uptrend.
DOT / U.S. dollar (DOTUSD) Trading Strategy: The wave II correction seems to be over and the price is re-entering the main trend, so look for an opportunity to re-join the trend in an uptrend.
DOT / U.S. dollar (DOTUSD) Technical Indicators: The price is below the MA200 indicating a downtrend, The Wave Oscillator is a Bearish Momentum.
DOT/USD daily chart
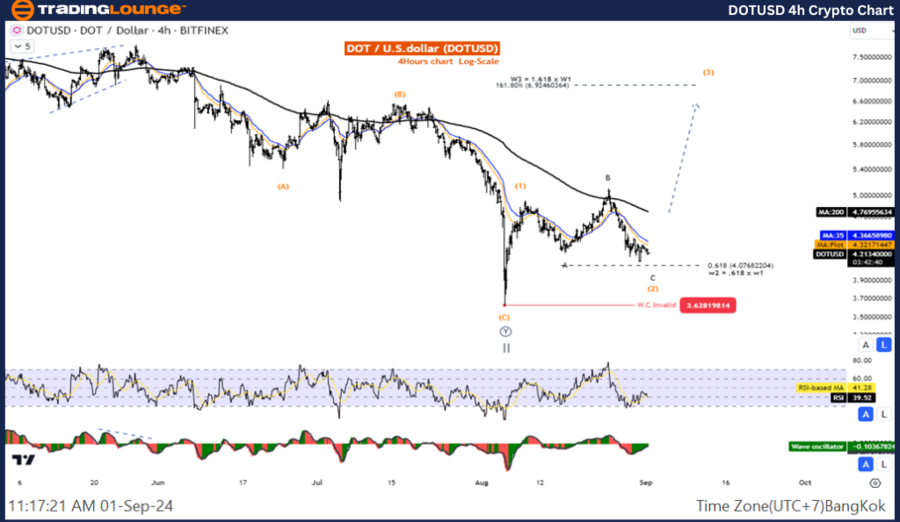
DOT/USD Elliott Wave technical analysis
Function: Counter Trend.
Mode: Corrective.
Structure: Double Corrective.
Position: Wave ((Y)).
Direction next higher degrees: Wave II.
Details: The Decline of wave II Beware, a drop below 3.566 will break the uptrend.
DOT / U.S. dollar (DOT/USD) Trading Strategy: The wave II correction seems to be over and the price is re-entering the main trend, so look for an opportunity to re-join the trend in an uptrend.
DOT / U.S. dollar (DOT/USD)Technical Indicators: The price is below the MA200 indicating a downtrend, The Wave Oscillator is a Bearish Momentum.
DOT/USD four-hour chart
Polkadot Elliott Wave technical analysis [Video]
Author

Peter Mathers
TradingLounge
Peter Mathers started actively trading in 1982. He began his career at Hoei and Shoin, a Japanese futures trading company.