Polkadot (DOT/USD) Elliott Wave technical analysis [Video]
![Polkadot (DOT/USD) Elliott Wave technical analysis [Video]](https://editorial.fxsstatic.com/images/i/DOT-bullish-object_XtraLarge.png)
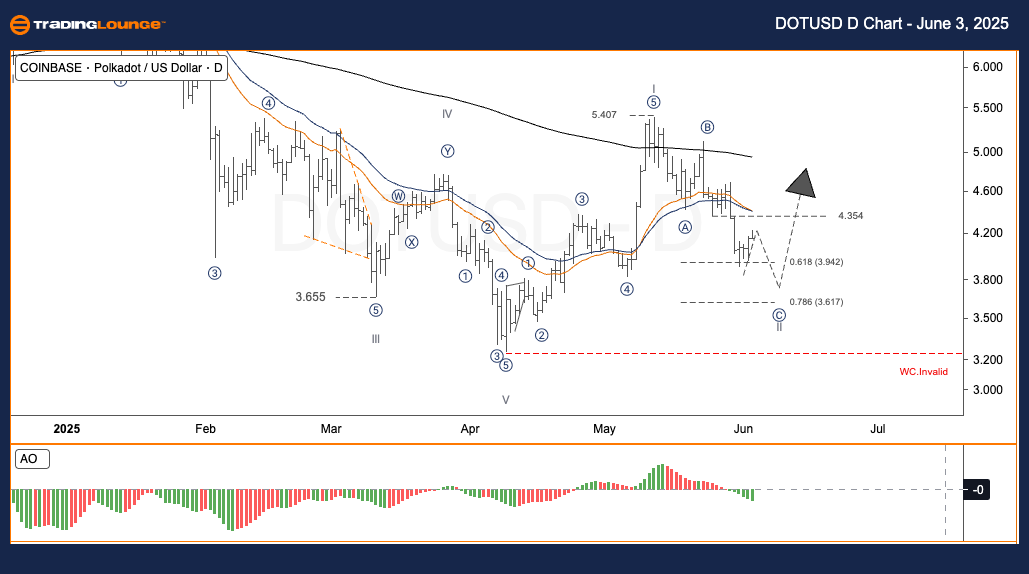
DOT/USD Elliott Wave technical analysis
-
Function: Follow Trend.
-
Mode: Motive.
-
Structure: Impulse.
-
Position: Wave 2.
-
Next higher degrees direction: N/A.
-
Invalidation level: N/A.
Trading strategy – Daily chart
DOT is undergoing a wave II correction. Once completed, wave III may begin, which often exhibits strong momentum in Elliott Wave theory. Wave I ended at $5.407 and followed a clear five-wave pattern. Currently, wave II unfolds as an ABC correction. Target levels for wave C are:
- Fib 0.618 ≈ $3.94.
- Fib 0.786 ≈ $3.62.
Suggested strategies
- For short-term traders (swing trade):
- Monitor price action near $3.62–$3.94.
- Look for bullish reversal patterns (e.g., Pin Bar, Engulfing).
- Risk management:
- Set Stop Loss below $3.40 (invalid level for wave count).
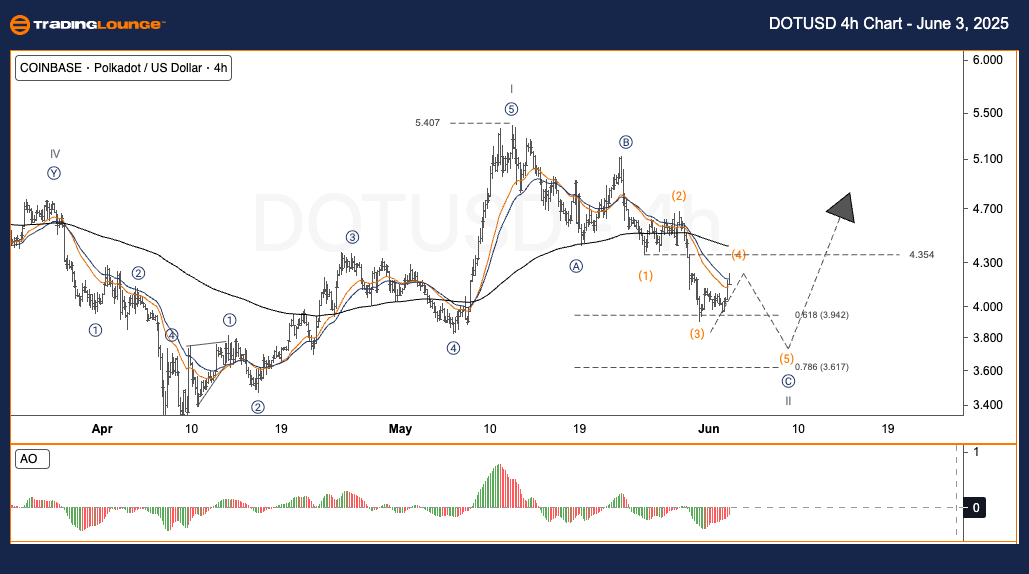
DOT/USD Elliott Wave technical analysis
-
Function: Follow Trend.
-
Mode: Motive.
-
Structure: Impulse.
-
Position: Wave 2.
-
Next higher degrees direction: N/A.
-
Invalidation level: N/A.
Trading strategy – Four-hour chart
Polkadot (DOT) is in wave II correction phase, setting the stage for a wave III rally. The first wave (Wave I) ended at $5.407 with a five-wave internal structure. The market now corrects through wave II in an ABC formation. Price targets for wave C are:
- Fib 0.618 ≈ $3.94.
- Fib 0.786 ≈ $3.62.
Suggested strategies
- For short-term traders (swing trade):
- Wait for a test of the $3.62–$3.94 zone.
- Identify bullish reversal signals.
- Risk management:
-
- Place Stop Loss below $3.40.
Polkadot (DOT/USD) Elliott Wave technical analysis [Video]
Author

Peter Mathers
TradingLounge
Peter Mathers started actively trading in 1982. He began his career at Hoei and Shoin, a Japanese futures trading company.


