Pi Network Price Forecast: PI explodes toward $1.00 on generative AI integration optimism
- Pi Network rallied in double digits, testing resistance at the 100-period EMA on the 8-hour chart near $0.66.
- After marking 100 days since the launch of Open Network, the Pi Network team eyes generative AI integration.
- Support at the 50-day EMA around $0.59, alongside a MACD buy signal, could boost the uptrend toward $1.00.

Pi Network (PI) is on the move, rallying in double-digit gains to trade at around $0.63 at the time of writing on Wednesday. The breakout extends the recovery from the weekend sell-off to $0.46, buoyed by sentiment surrounding the potential integration of generative Artificial Intelligence (AI).
Pi Network steadies uptrend on community sentiment
The Pi Network team hinted at the possibility of integrating GenAI after the protocol marked the first 100 days since the launch of the Open Network blockchain. A panel discussion featuring Nicolas Kokkalis, the project’s co-founder, as reported by FXStreet, boosted social buzz, with positive sentiment ticking higher.
Santiment data shows elevated mentions on social channels, including X, Telegram and Reddit. Based on the Social Volume chart below, the buzz around PI has steadied this week, reaching 35 on Wednesday.
 [19-1750870149215.19.24, 25 Jun, 2025].png)
Pi Network Social Volume metric | Source: Santiment
Positive sentiment rose in tandem with social volume, as observed in the chart below. A steady increase in sentiment has the potential to sway price action upward.
 [19-1750870170698.25.19, 25 Jun, 2025].png)
Pi Network Social Sentiment metric | Source: Santiment
The Pi Network team is expected to provide details of co-founder Kokkalis’ panel discussion, which may confirm the plausibility of GenAI integration. Interest in the intersection of AI and blockchain technology continues to gain momentum in the broader cryptocurrency market, which may explain the hype surrounding the June 28 announcement.
Technical outlook: PI upholds uptrend, aiming for $1.00
The PI price presents bullish technical signals, starting with the Moving Average Convergence Divergence (MACD) indicator, as it rebounds around the midline. A buy signal confirmed on Monday continues to influence risk-on sentiment, encouraging traders to seek exposure to the token.
The 100-period Exponential Moving Average (EMA) resistance at $0.66 and the 50-period EMA at $0.59 on the 8-hour chart below could influence the direction the PI price takes in upcoming sessions or days. A price movement above the resistance level could drive the PI price upward toward $1.00.
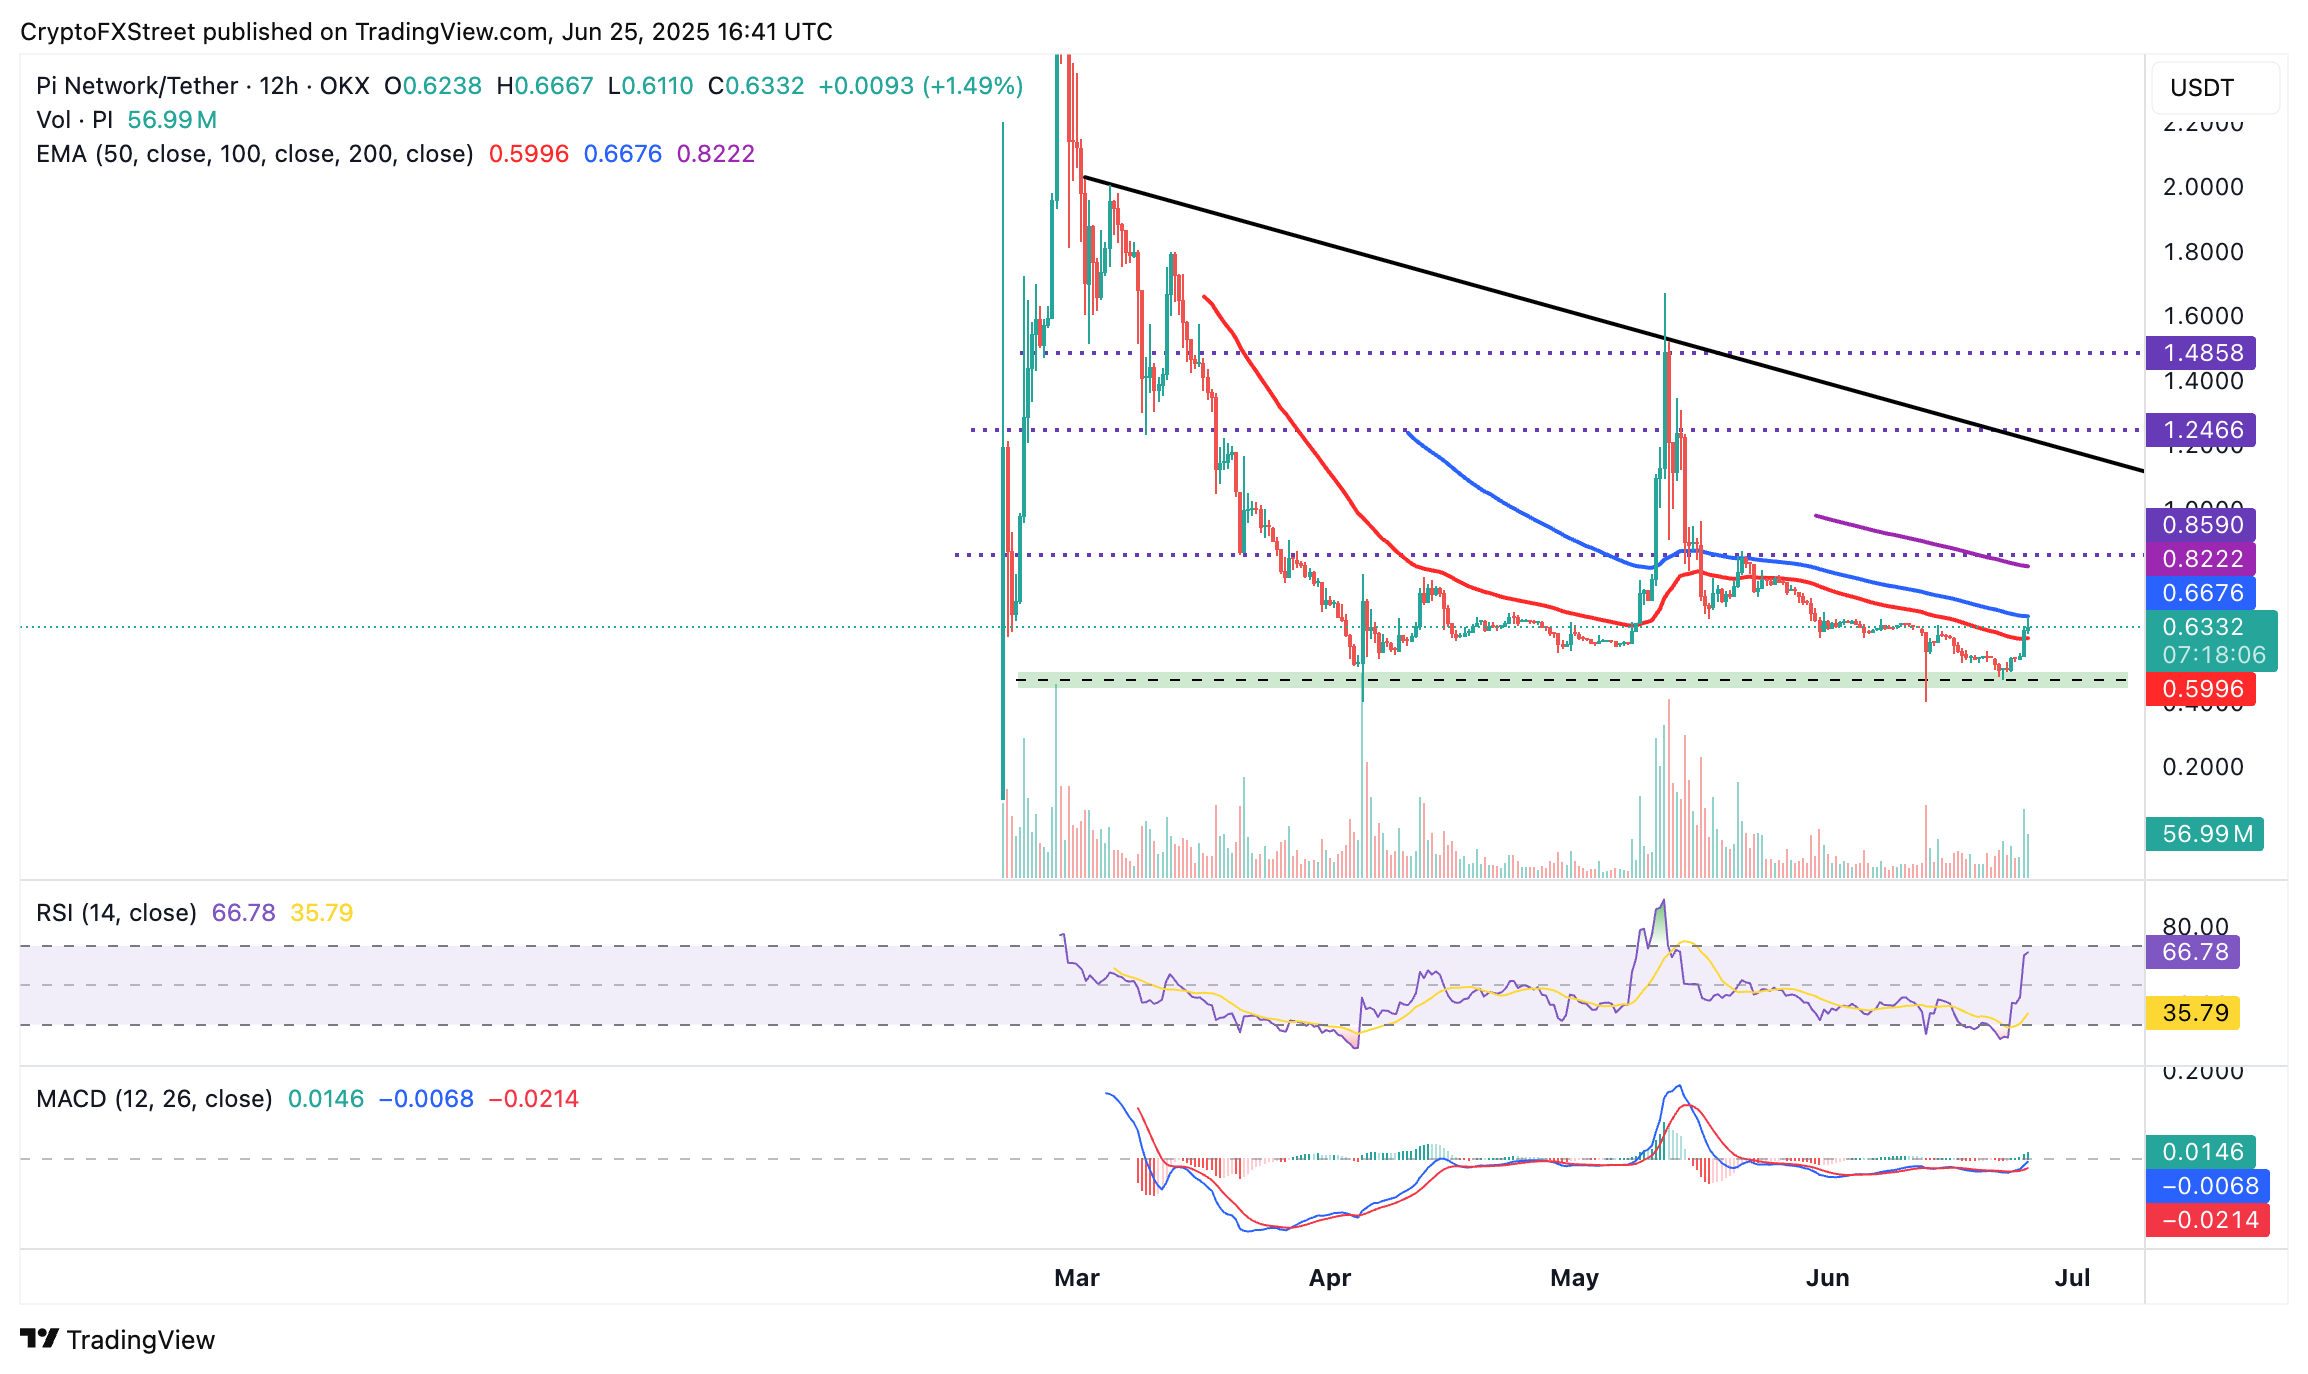
PI/USDT 8-hour chart
On the contrary, PI could claw back the gains accrued in the last few days if the 50-period EMA support at $0.59 fails to hold. The weekend low of around $.46 remains an area of interest to traders, at least until PI breaks above the $1.00 level and the descending trendline resistance.
Cryptocurrency metrics FAQs
The developer or creator of each cryptocurrency decides on the total number of tokens that can be minted or issued. Only a certain number of these assets can be minted by mining, staking or other mechanisms. This is defined by the algorithm of the underlying blockchain technology. On the other hand, circulating supply can also be decreased via actions such as burning tokens, or mistakenly sending assets to addresses of other incompatible blockchains.
Market capitalization is the result of multiplying the circulating supply of a certain asset by the asset’s current market value.
Trading volume refers to the total number of tokens for a specific asset that has been transacted or exchanged between buyers and sellers within set trading hours, for example, 24 hours. It is used to gauge market sentiment, this metric combines all volumes on centralized exchanges and decentralized exchanges. Increasing trading volume often denotes the demand for a certain asset as more people are buying and selling the cryptocurrency.
Funding rates are a concept designed to encourage traders to take positions and ensure perpetual contract prices match spot markets. It defines a mechanism by exchanges to ensure that future prices and index prices periodic payments regularly converge. When the funding rate is positive, the price of the perpetual contract is higher than the mark price. This means traders who are bullish and have opened long positions pay traders who are in short positions. On the other hand, a negative funding rate means perpetual prices are below the mark price, and hence traders with short positions pay traders who have opened long positions.
Author

John Isige
FXStreet
John Isige is a seasoned cryptocurrency journalist and markets analyst committed to delivering high-quality, actionable insights tailored to traders, investors, and crypto enthusiasts. He enjoys deep dives into emerging Web3 tren


