Pi Network Price Forecast: Reduced pressure signals reversal chances
- Pi Network holds steady above $0.1350 on Friday after rising over 2% the previous day from a crucial support level.
- PI-supporting CEXs record net withdrawals over 24 hours as Pi Foundation outflows slow, suggesting increased buying pressure.
- The technical outlook for PI highlights a potential double-bottom reversal at a crucial support level.

Pi Network (PI) is up almost 1% at press time on Friday, extending the 2% gains from the previous day. Renewed buying pressure, evidenced by increased withdrawals from exchanges supporting the PI token, and reduced outflows from the Pi Foundation, adds tailwinds. The technical outlook for PI is bullish in the short term, driven by the likelihood of a double-bottom reversal at a key support level.
On-chain data points to reduced headwinds
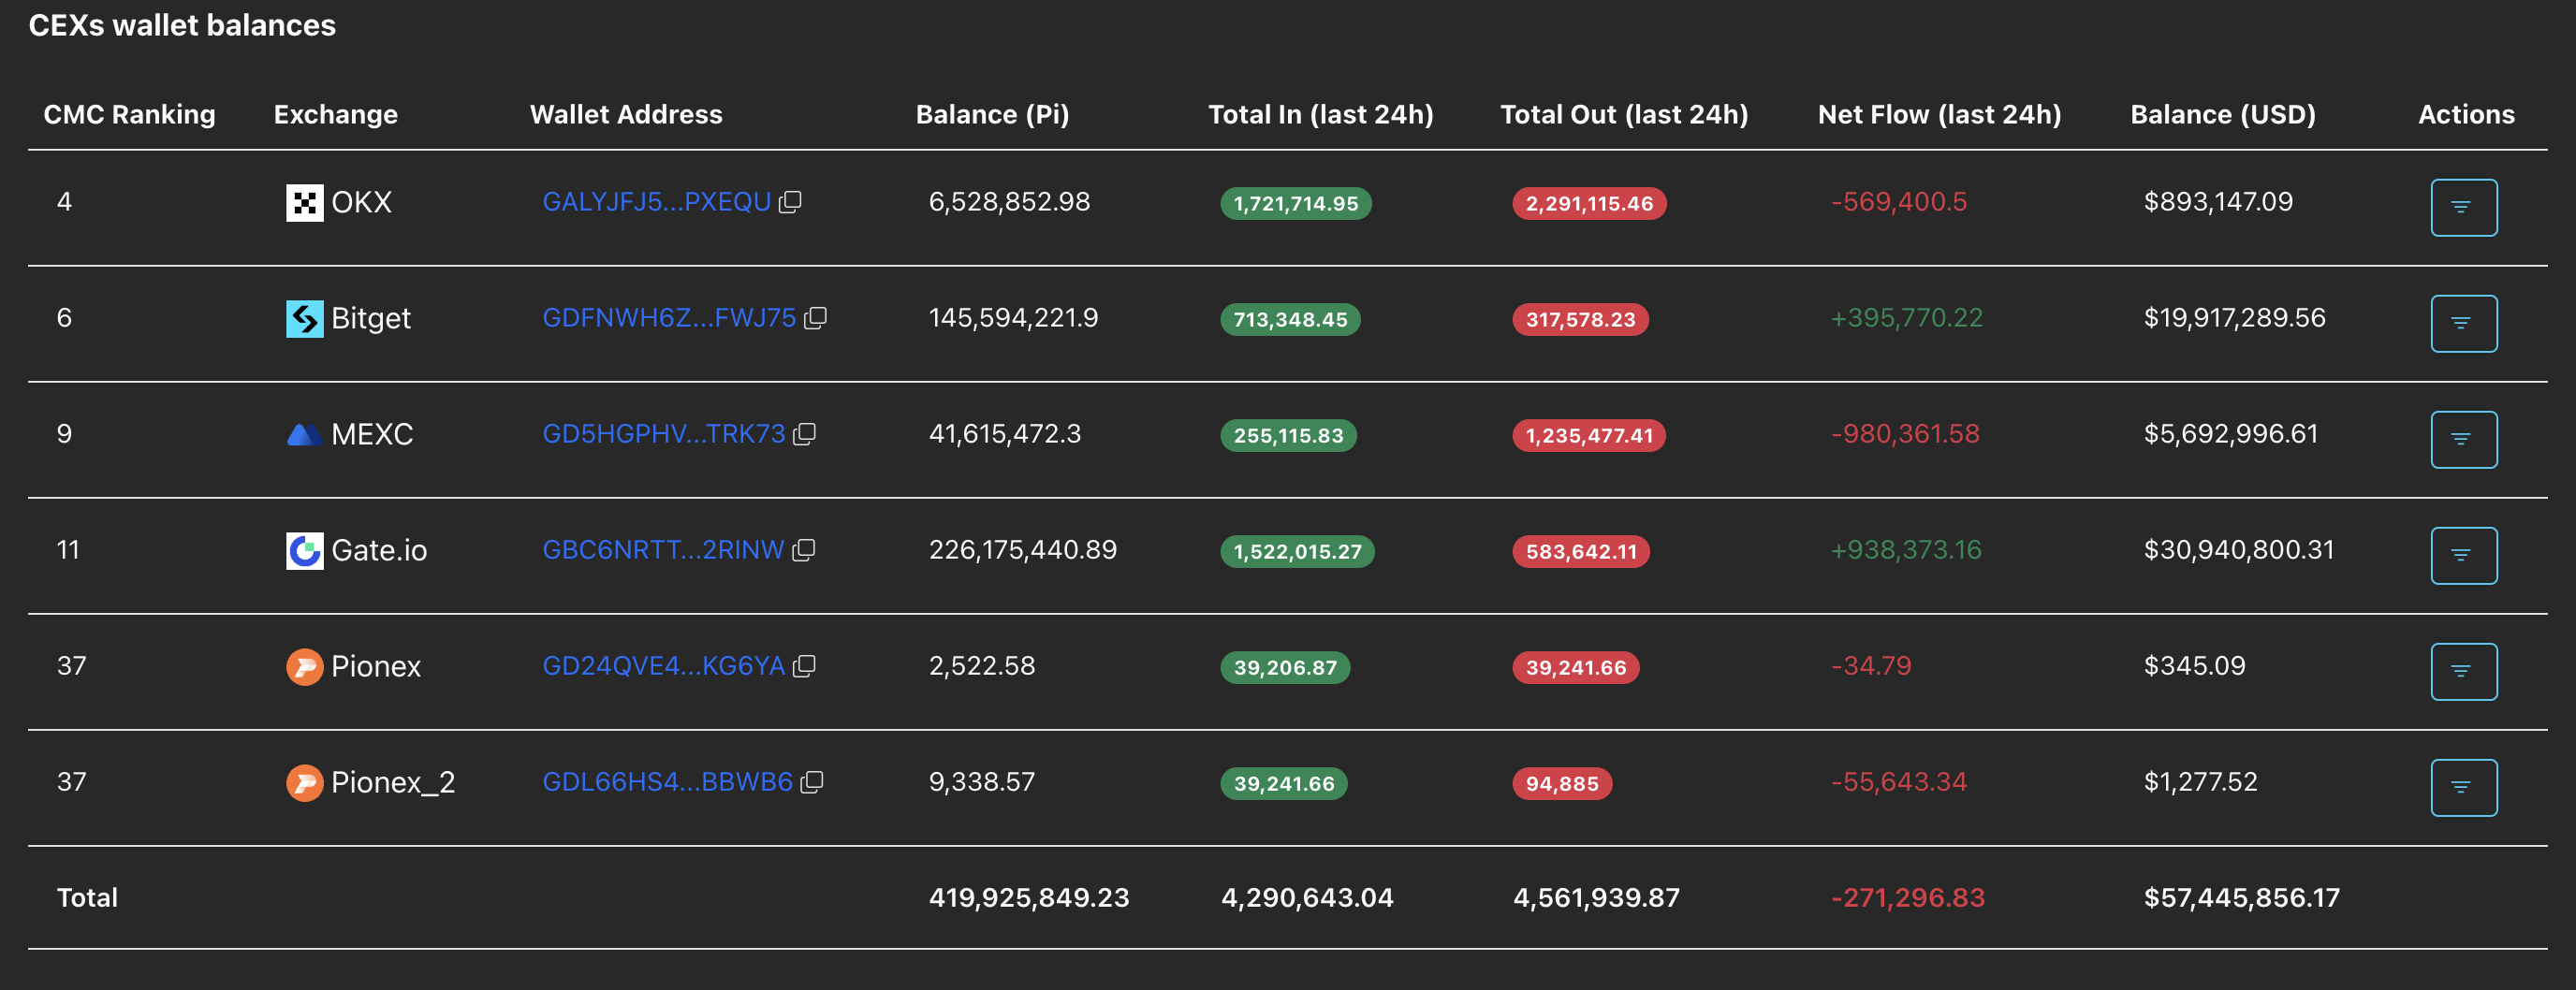
PI scan data shows that Centralized Exchanges (CEXs) have recorded a net outflow of 271,296 PI tokens over the last 24 hours, suggesting renewed buying pressure as investor confidence rebuilds.
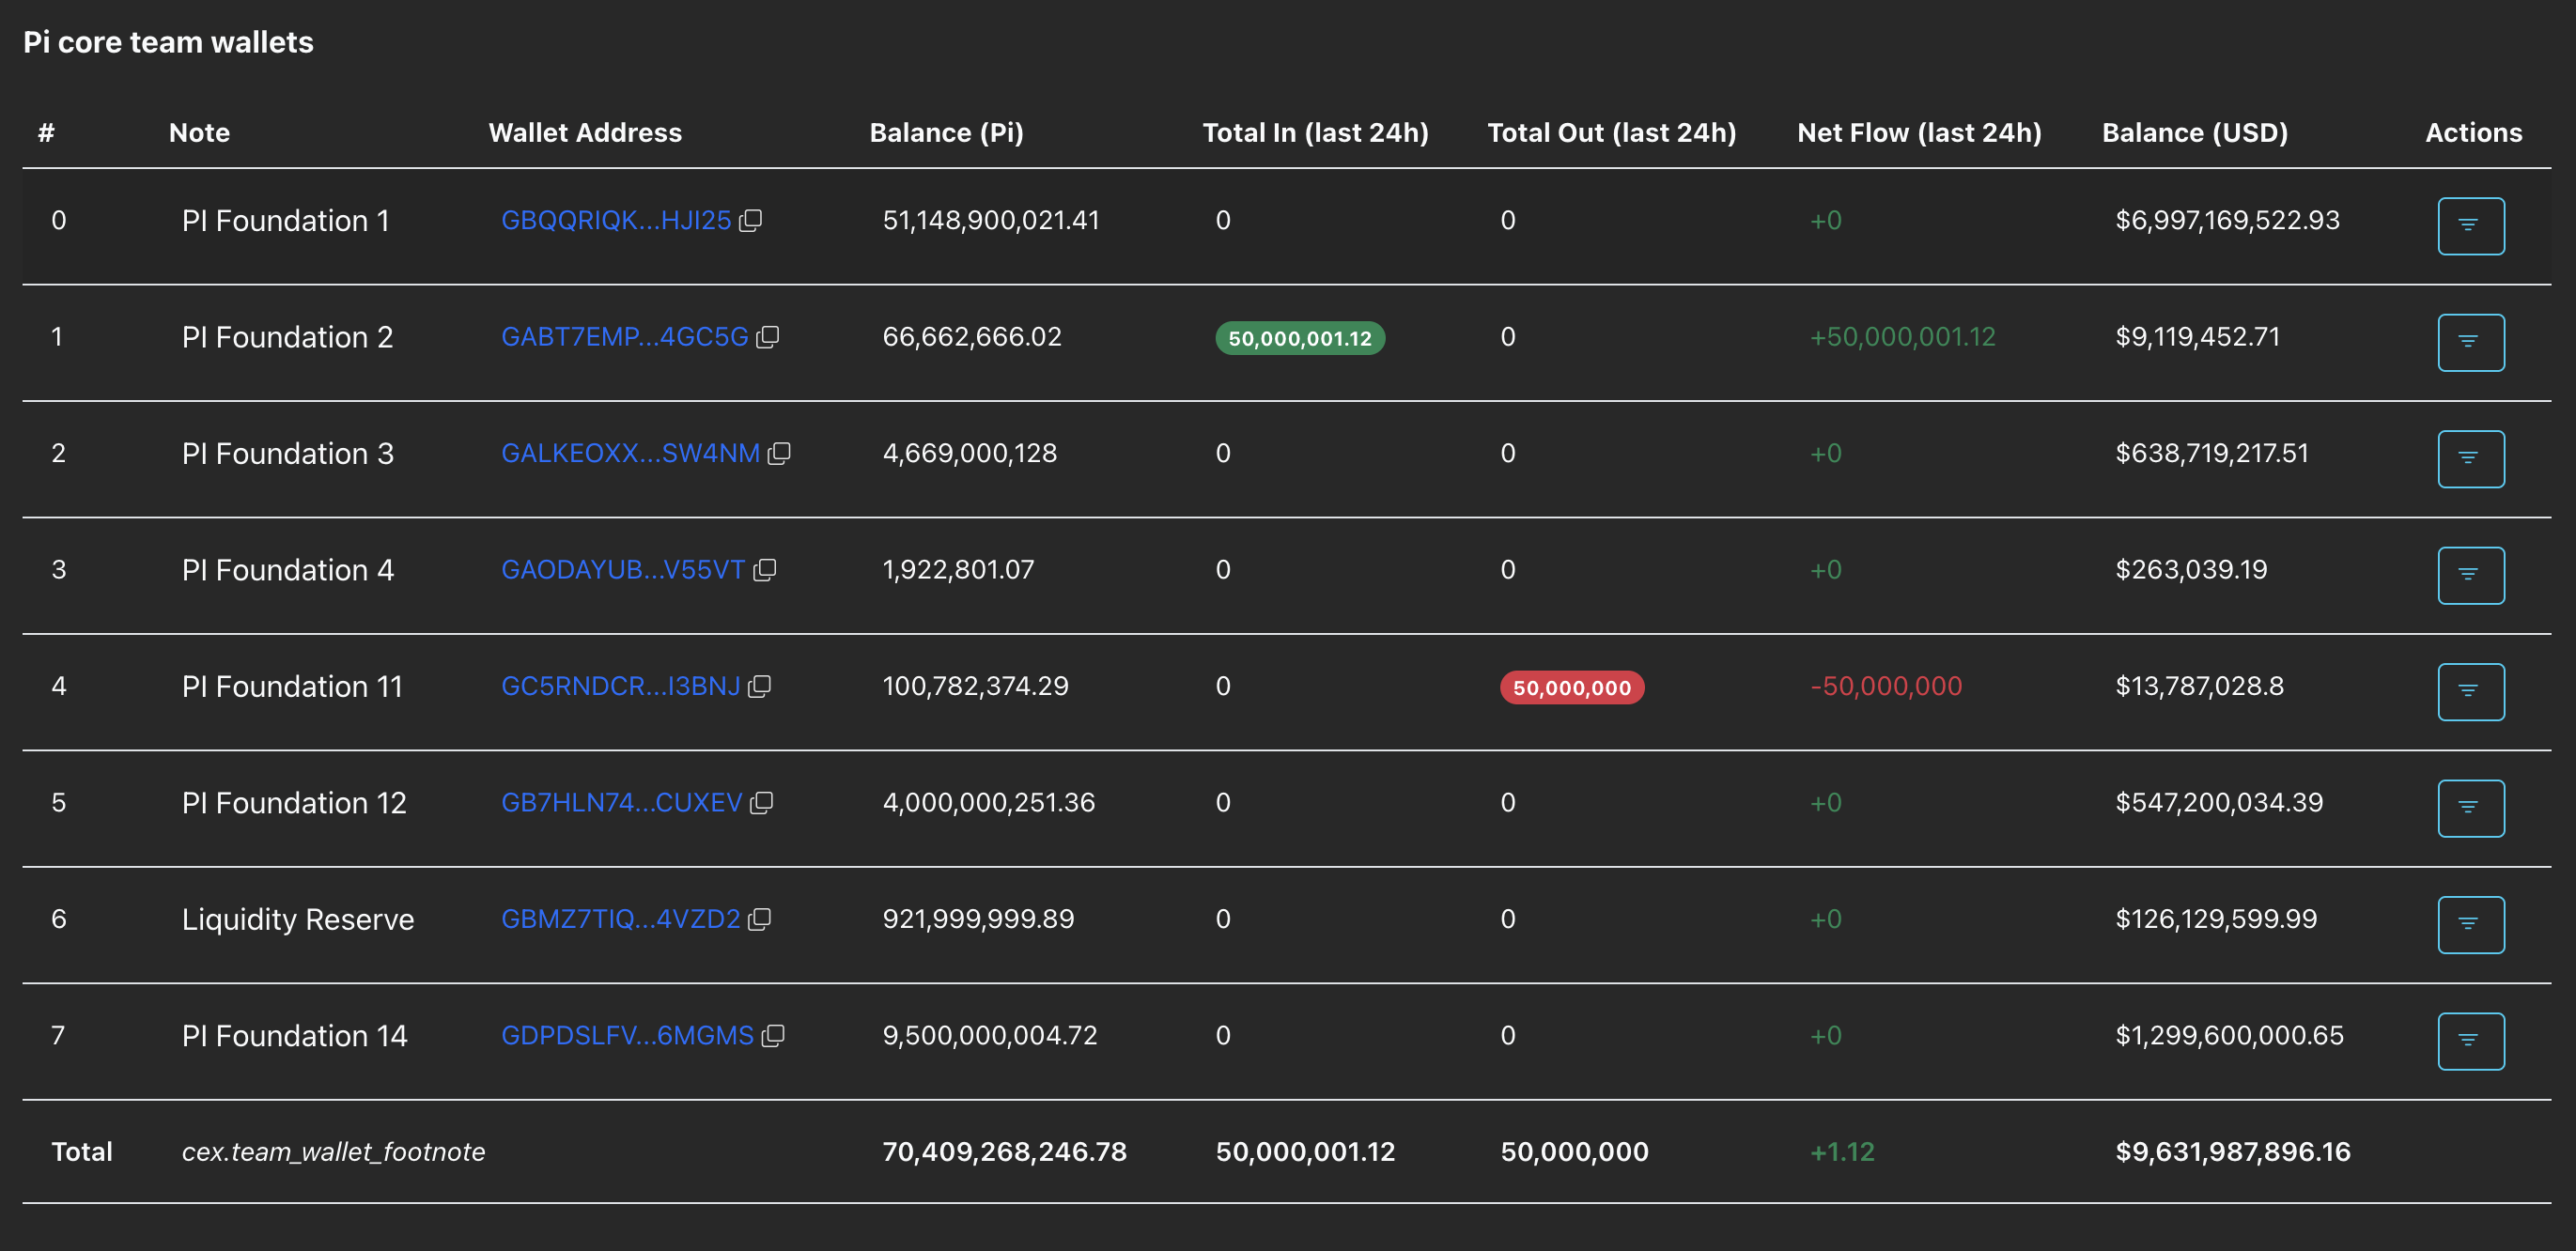
The Pi core team wallets, which have previously recorded major outflows, made a strategic shift of 50 million PI tokens, without any significant outflows in the last 24 hours. This signals reduced outflow from PI Foundation, which limits the downside pressure. If the trend continues, a limited supply dump and steady CEXs outflows could support the short-term recovery in PI token.
Pi Network prepares for a rebound from key support
PI token is approaching the $0.1400 round figure after bouncing off the S1 pivot point at $0.1327 the previous day. The sudden recovery suggests a double-bottom reversal, as the support was previously tested by the February 6 low at $0.1300.
The immediate resistance for the PI token is at $0.1533, aligning with the October 10 low. A steady close above this level could target the 50-day Exponential Moving Average at $0.1763.
However, the downward-sloping 50- and 200-day EMAs reaffirm the prevailing bearish bias and are likely to cap gains in an extended recovery.
The technical indicators on the daily chart back the short-term rebound thesis despite prevailing downside pressure. The Relative Strength Index (RSI) is at 26, remaining in the oversold zone and suggesting a potential rebound, typically seen at saturated levels of selling pressure.
At the same time, the Moving Average Convergence Divergence (MACD) converges with the signal line as negative histogram bars recede, suggesting a bullish crossover as bearish momentum wanes.
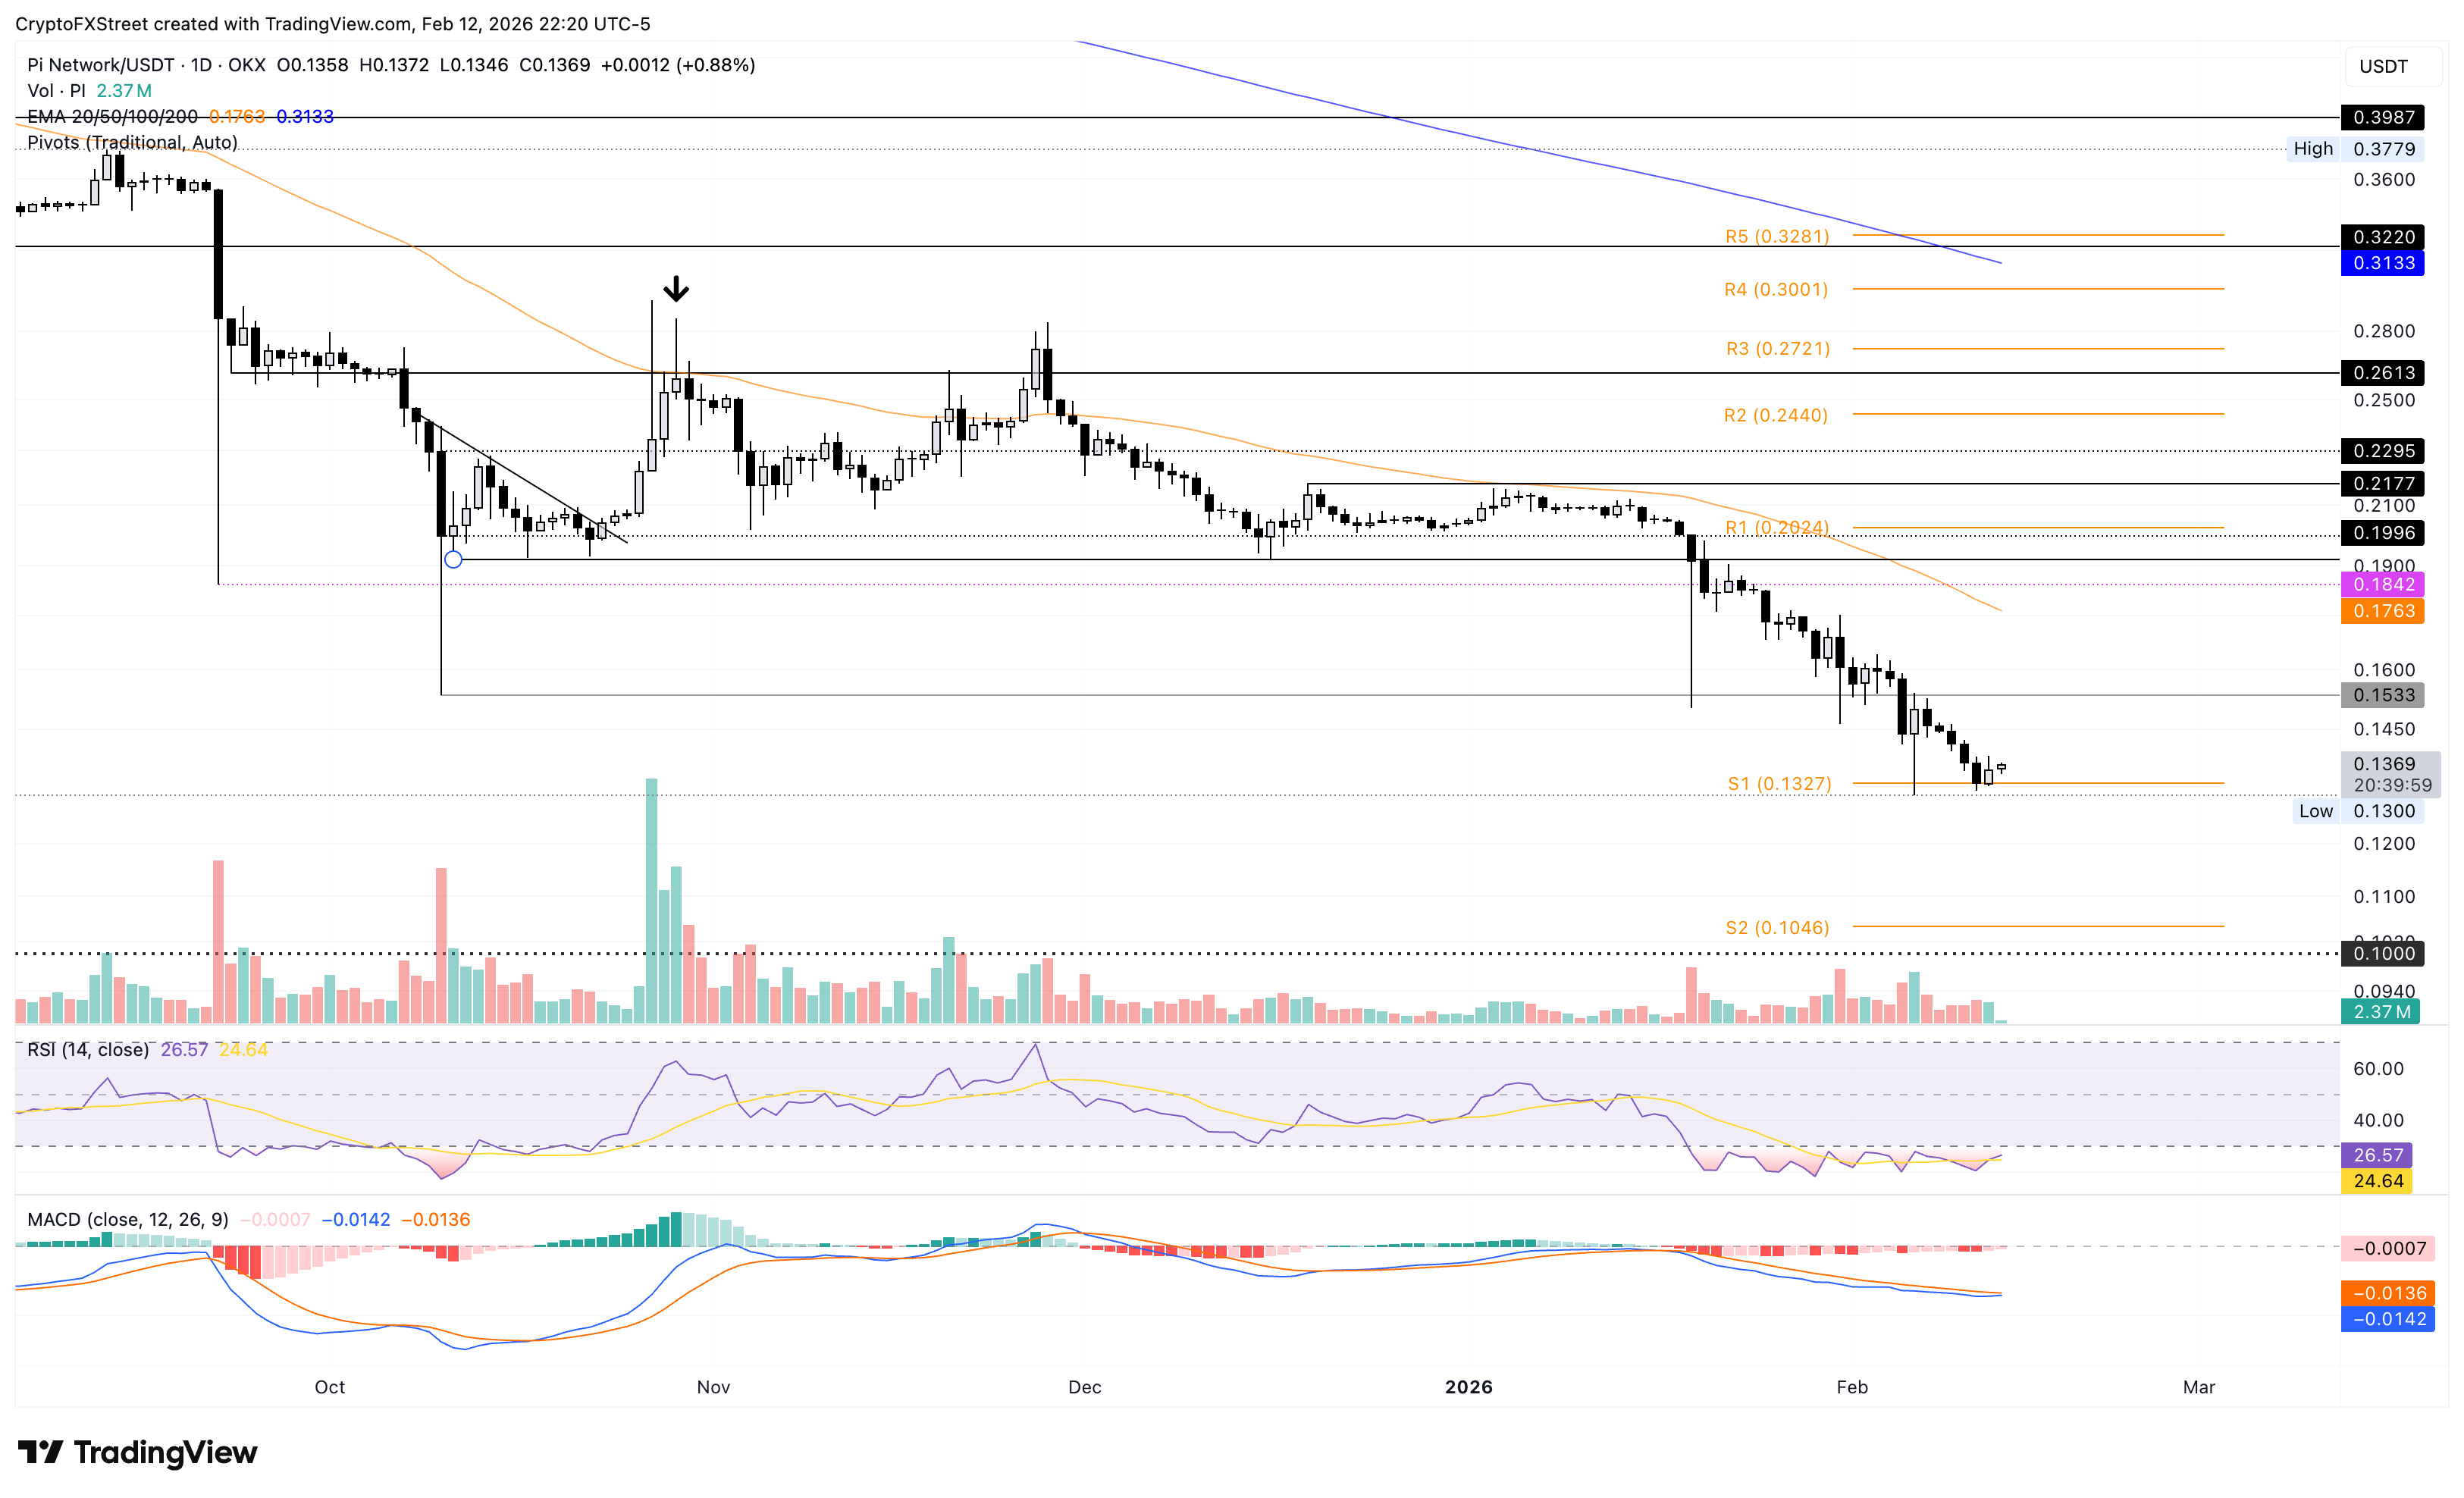
However, if the PI token slips below the S1 pivot point at $0.1327 on a daily close, it could extend the decline to the S2 pivot point at $0.1046.
Crypto ETF FAQs
An Exchange-Traded Fund (ETF) is an investment vehicle or an index that tracks the price of an underlying asset. ETFs can not only track a single asset, but a group of assets and sectors. For example, a Bitcoin ETF tracks Bitcoin’s price. ETF is a tool used by investors to gain exposure to a certain asset.
Yes. The first Bitcoin futures ETF in the US was approved by the US Securities & Exchange Commission in October 2021. A total of seven Bitcoin futures ETFs have been approved, with more than 20 still waiting for the regulator’s permission. The SEC says that the cryptocurrency industry is new and subject to manipulation, which is why it has been delaying crypto-related futures ETFs for the last few years.
Yes. The SEC approved in January 2024 the listing and trading of several Bitcoin spot Exchange-Traded Funds, opening the door to institutional capital and mainstream investors to trade the main crypto currency. The decision was hailed by the industry as a game changer.
The main advantage of crypto ETFs is the possibility of gaining exposure to a cryptocurrency without ownership, reducing the risk and cost of holding the asset. Other pros are a lower learning curve and higher security for investors since ETFs take charge of securing the underlying asset holdings. As for the main drawbacks, the main one is that as an investor you can’t have direct ownership of the asset, or, as they say in crypto, “not your keys, not your coins.” Other disadvantages are higher costs associated with holding crypto since ETFs charge fees for active management. Finally, even though investing in ETFs reduces the risk of holding an asset, price swings in the underlying cryptocurrency are likely to be reflected in the investment vehicle too.
Author

Vishal Dixit
FXStreet
Vishal Dixit holds a B.Sc. in Chemistry from Wilson College but found his true calling in the world of crypto.



