Pepe Price Prediction: PEPE risks breakdown as holders realize losses, momentum fades
- Pepe price is nearing an ascending trendline; a break below could trigger a sharp correction.
- Santiment NPL data indicates that PEPE holders are realizing losses, signaling a waning confidence.
- Momentum indicators are weakening, suggesting a potential double-digit crash ahead.

Pepe (PEPE) price is approaching a key ascending trendline level at $0.0000103 at the time of writing on Tuesday. A daily close below this level would signal a correction ahead. On-chain data also supports the bearish outlook, as PEPE holders are realizing losses. The frog-themed meme coin faces a heightened risk of a sharp pullback, as its momentum indicators show weakness, potentially leading to a double-digit decline on the horizon.
Pepe's on-chain metrics signal waning investors' confidence
Santiment’s Network Realized Profit/Loss (NPL) metric shows a bearish bias. The indicator decreased from 189,150 to -50.21 million between Sunday and Monday. This negative drop in the NPL metric indicates that PEPE's holders, on average, are realizing losses, signaling a waning of investors' confidence.
During the same day, Pepe's supply on exchanges metric rose from 103.55 trillion to 104.12 trillion. This increase in supply on exchanges indicates that holders are moving PEPE tokens to exchanges, which could increase selling activity, further supporting the bearish outlook.
 [10-1750141043229.15.01, 17 Jun, 2025].png)
Pepe’s NPL and Supply on Exchange chart. Source: Santiment
IntoTheBlock on-chain signals summary, as shown in the chart below, also projects a bearish outlook.
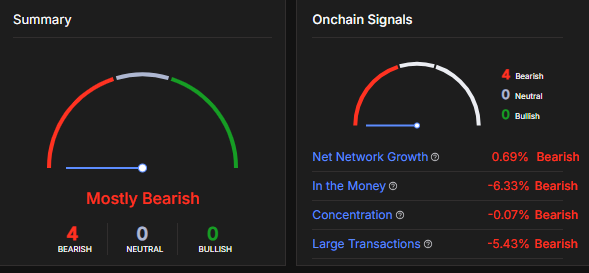
Pepe Summary chart. Source: IntoTheBlock
Pepe Price Prediction: Momentum indicators show a bearish bias
Pepe price broke below its 50-day Exponential Moving Average (EMA) at $0.0000114 on Thursday and declined by nearly 9% until Monday. At the time of writing on Tuesday, PEPE is nearing an ascending trendline (drawn by connecting multiple lows since early April), coinciding with the daily support at $0.0000103, making it a key zone to watch.
If Pepe breaks below the ascending trendline and closes below $0.0000103 on a daily basis, it could extend the decline by 15% to retest its next daily support at $0.0000088. A successful close below this level could extend the decline toward $0.0000079, the next daily support level.
The Relative Strength Index (RSI) indicator on the daily chart reads 40 and points downward, indicating increasing bearish momentum. Moreover, the Moving Average Convergence Divergence (MACD) displayed a bearish crossover last week. It also shows red histogram bars below its neutral level, indicating a downward trend and further supporting the bearish thesis.
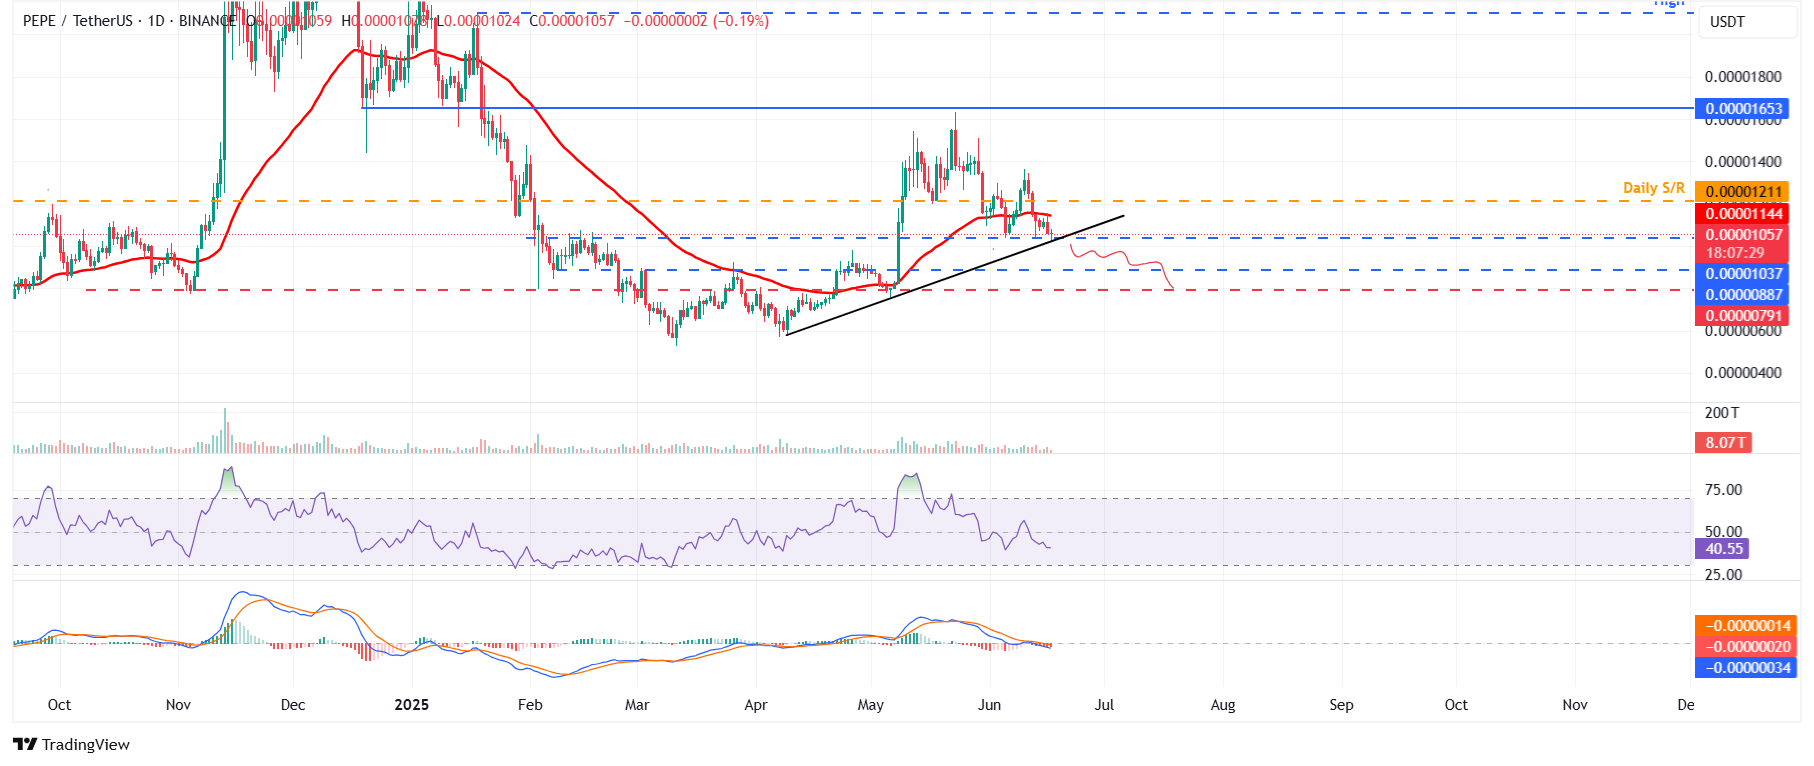
PEPE/USDT daily chart
However, if Pepe finds support around the ascending trendline and recovers, it could extend the recovery toward the 50-day EMA at $0.0000114.
Author

Manish Chhetri
FXStreet
Manish Chhetri is a crypto specialist with over four years of experience in the cryptocurrency industry.


