Dogecoin, Shiba Inu, and Pepe meme coins signal fading bullish momentum
- Dogecoin price hovers around $0.19 after falling nearly 14% the previous week.
- Shiba Inu closes below its 50-day EMA, suggesting a potential double-digit decline could unfold.
- Pepe holds above critical support at $0.0000115; a decisive break lower may trigger further downside pressure.

Meme coins, Dogecoin (DOGE), Shiba Inu (SHIB), and Pepe (PEPE) are under pressure as the broader crypto market struggles to regain momentum. DOGE and SHIB exhibit signs of weakness following a close below their key levels, while PEPE clings to a crucial support level, with a breakdown likely to accelerate its ongoing correction.
Dogecoin could extend its downleg if it closes below $0.18
Dogecoin price closed below its 200-day Exponential Moving Average (EMA) at $0.21 on Thursday and declined by nearly 10% the next day. At the time of writing on Monday, it trades lower, approaching its weekly support at $0.18.
If DOGE corrects and closes below its weekly level at $0.18 on a daily basis, it could extend the decline to the next support level at $0.15.
The Relative Strength Index (RSI) on the daily chart reads 39, below its neutral level of 50, indicating bearish momentum. The Moving Average Convergence Divergence (MACD) indicator also displayed a bearish crossover, indicating a potential sell signal and a correction ahead.
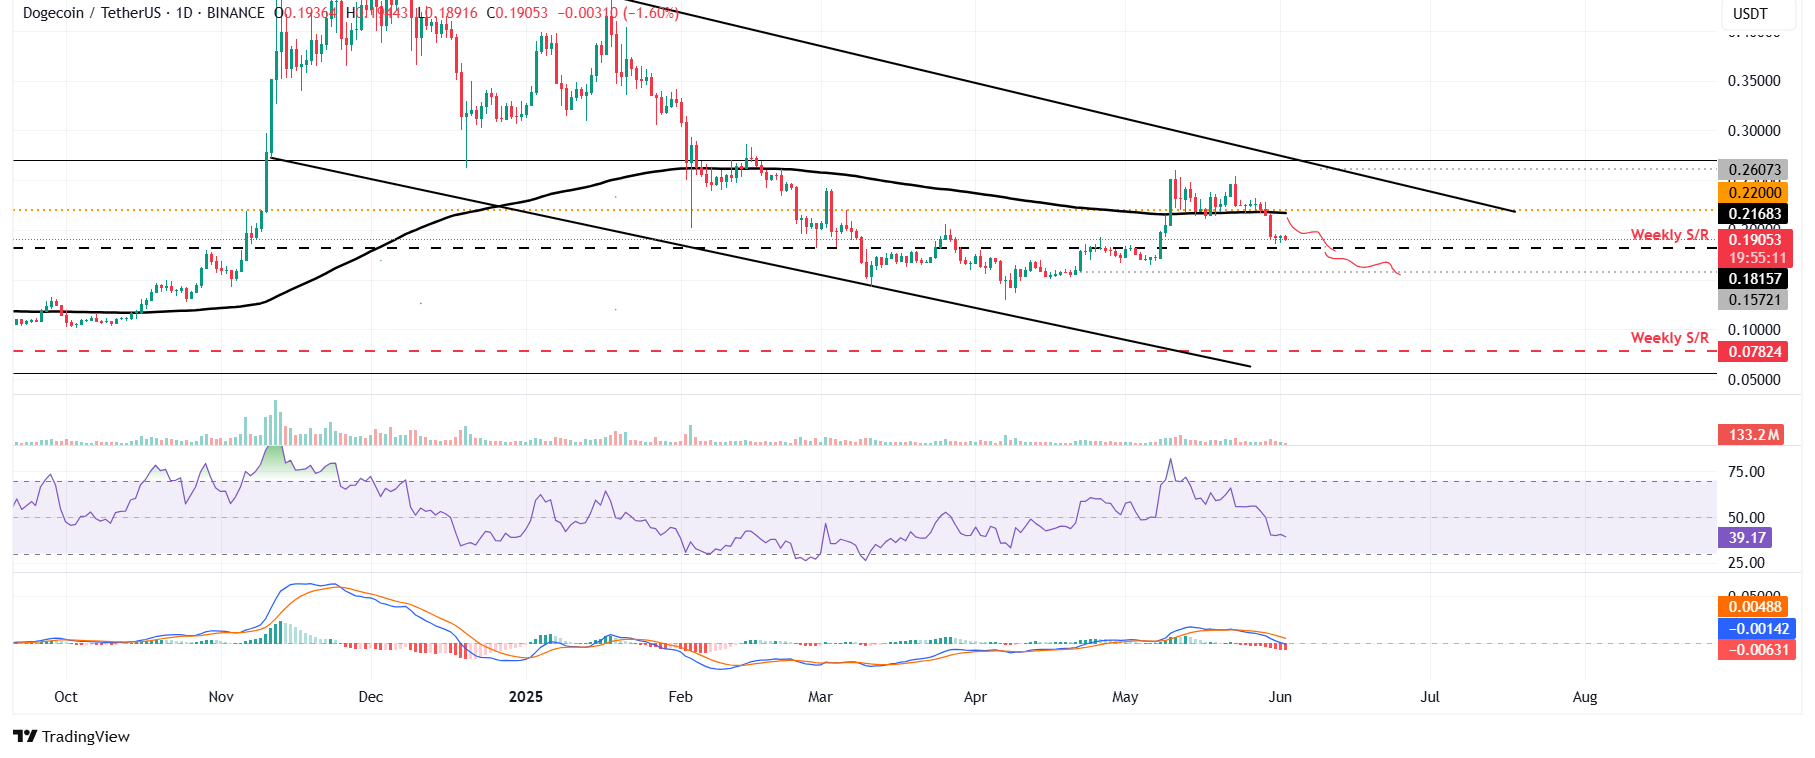
DOGE/USDT daily chart
If DOGE recovers, it could extend the recovery to retest its 200-day EMA at $0.21.
Shiba Inu bears could extend a 10% decline
Shiba Inu price closed below its 50-day EMA at $0.0000139 on Thursday and declined by 8.13% the following day. At the time of writing on Monday, it hovers at around $0.0000127.
If the 50-day EMA holds as resistance, SHIB could extend its decline by 10% from its current levels, potentially retesting its April 16 low of $0.0000114.
The RSI on the daily chart reads 38, below its neutral level of 50, indicating bearish momentum. The MACD indicator also displayed a bearish crossover. It also shows rising red histogram bars below its neutral level, indicating a correction ahead.
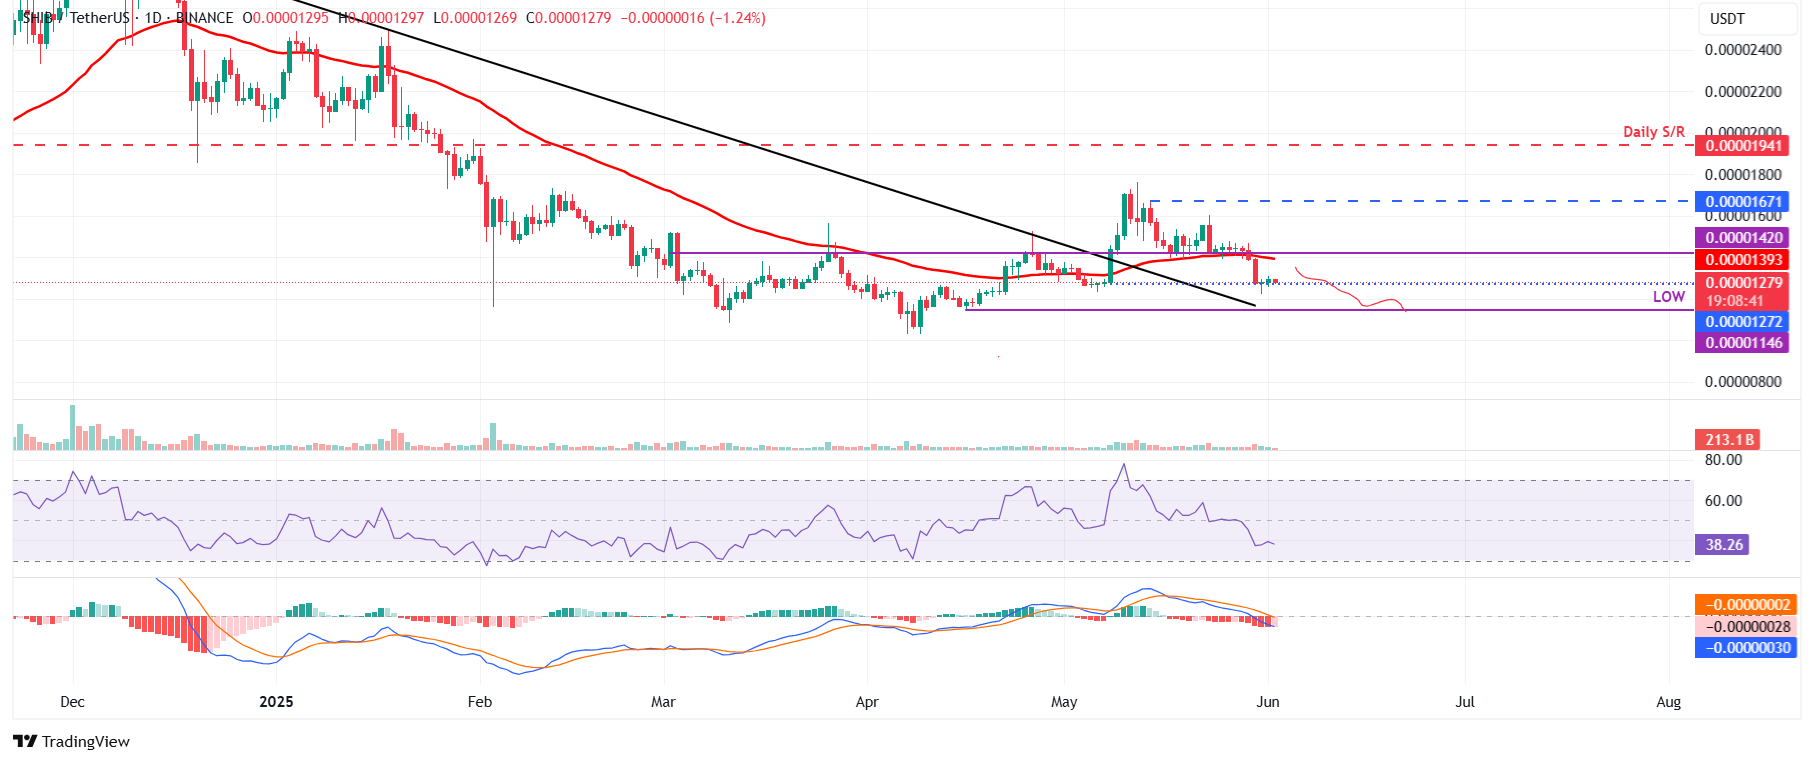
SHIB/USDT daily chart
If SHIB recovers, it could extend the recovery to retest its 50-day EMA at $0.0000139.
Pepe bearish momentum gains traction
Pepe price declined by more than 13% last week as a bearish divergence played out. However, it retested and found support around its 50-day EMA at $0.0000113 on the weekend. At the time of writing, it trades around $0.0000115.
If PEPE closes below the 50-day EMA, it could extend the decline to retest its next daily support at $0.0000103.
The RSI on the daily chart reads 44, below its neutral level of 50, indicating bearish momentum. The MACD indicator also displayed a bearish crossover. It also shows rising red histogram bars below its zero line, indicating a correction ahead.
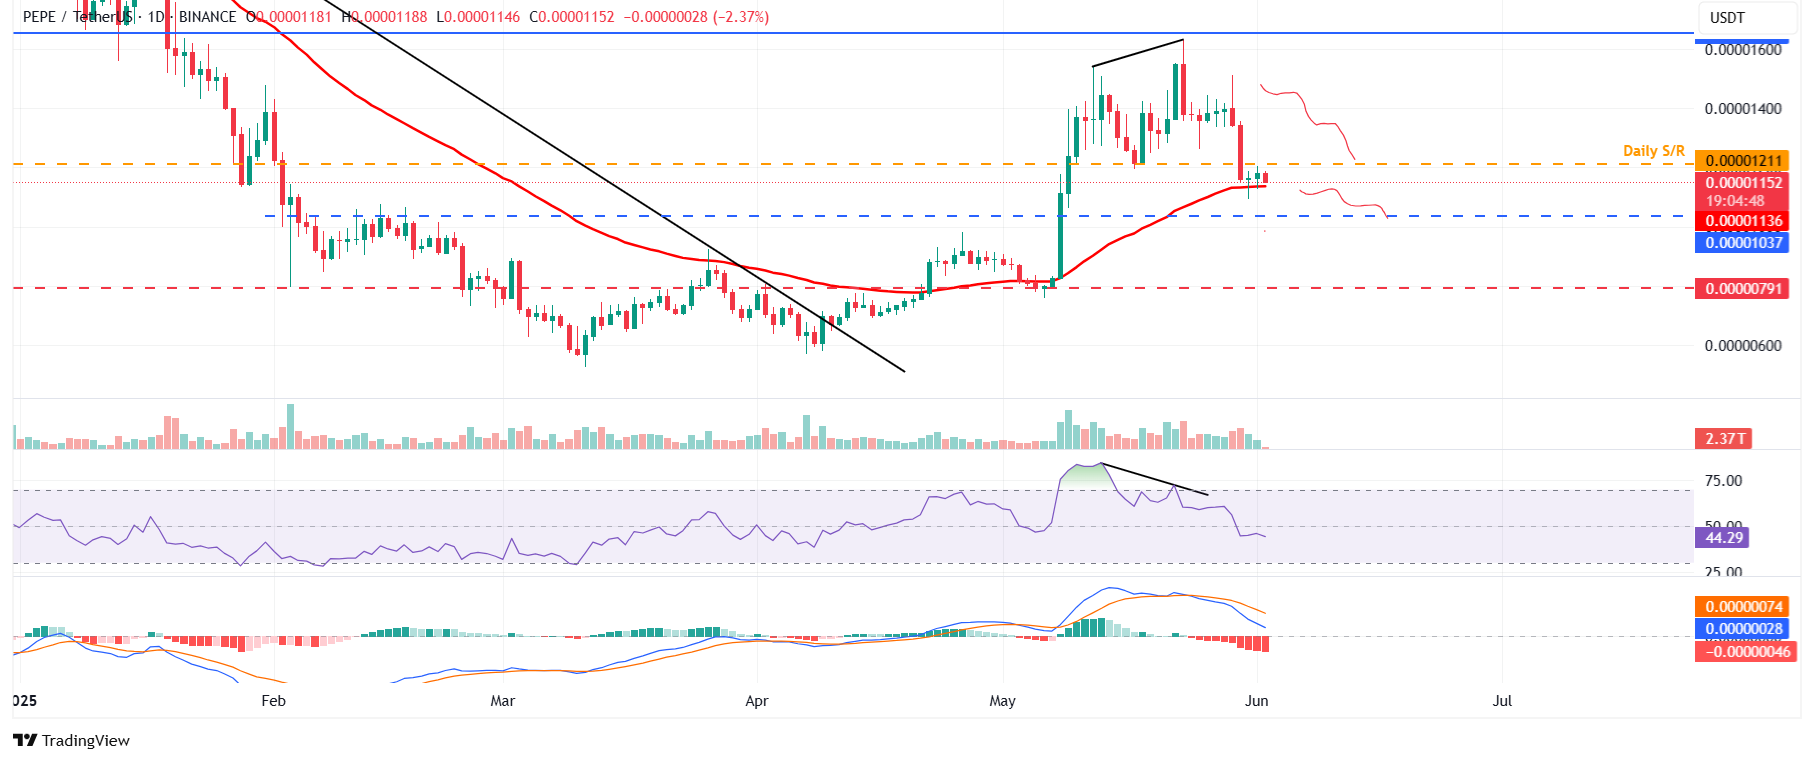
PEPE/USDT daily chart
However, if the PEPE price finds support around its 50-day EMA at $0.0000113, it could extend the recovery to retest its daily resistance level at $0.0000121.
Author

Manish Chhetri
FXStreet
Manish Chhetri is a crypto specialist with over four years of experience in the cryptocurrency industry.


