Altcoins to watch this week: Cronos and Toncoin at risk of double-digit crash as bearish signals emerge
- Cronos and Toncoin prices close below their ascending trendlines, indicating a shift from a bullish to a bearish market structure.
- Momentum indicators for CRO and TON also show signs of weakening, supporting the bearish outlook.
- The technical outlook suggests a double-digit price correction for both altcoins in the near term.

Altcoins Cronos (CRO) and Toncoin (TON) are showing signs of weakness this week, as both digital assets close below key ascending trendlines, signaling a potential shift in market structure. The technical outlook and indicators indicate weakening momentum, with a possible double-digit correction for CRO and TON in the coming days.
Cronos and Toncoin on-chain metrics show a bearish bias
Santiment Supply Distribution data showed that large wallets have been unloading Cronos tokens. The metric shows that the wallets holding between 10 million to 100 million (blue line) CRO tokens have fallen from 1.15 billion to 1.04 billion from Thursday to Tuesday.
During the same period, wallets holding between 100,000 to 1 million (red line) and 1 million to 10 million (yellow line) have increased from 140.07 million to 142.1 million and from 2.03 billion to 2.08 billion, respectively.
This development indicates that the first set of whales has unloaded CRO tokens in greater numbers than the combined purchase of the second cohort of whales, resulting in a net decline in total token holdings, which increases selling pressure and adds a bearish outlook for Cronos.
 [08-1750132979543.13.46, 17 Jun, 2025].png)
Cronos Supply Distribution Chart. Source: Santiment
Another bearish sign is Coinglass’s CRO long-to-short ratio, which reads 0.79, the lowest level in over a month. This ratio, below one, reflects bearish sentiment in the markets, as more traders are betting on the prices to fall.
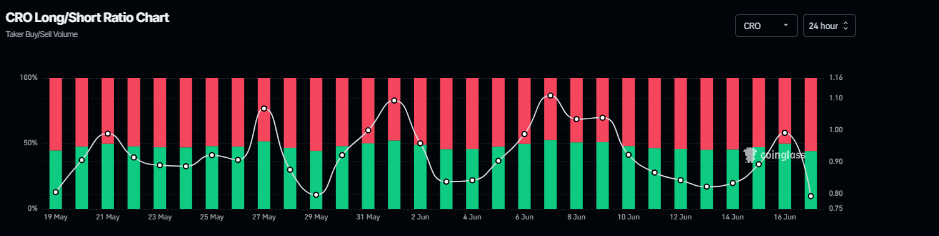
CRO long-to-short ratio chart. Source: Coinglass
Looking at Toncoin’s on-chain metrics also paints a bearish outlook. Crypto intelligence tracker Artemis data shows that TON’s chain DEX trading volume has consistently declined since early December and currently stands at $6.4 million as of Monday. This fall in volume signaled a decrease in user activity and liquidity on the TON blockchain.
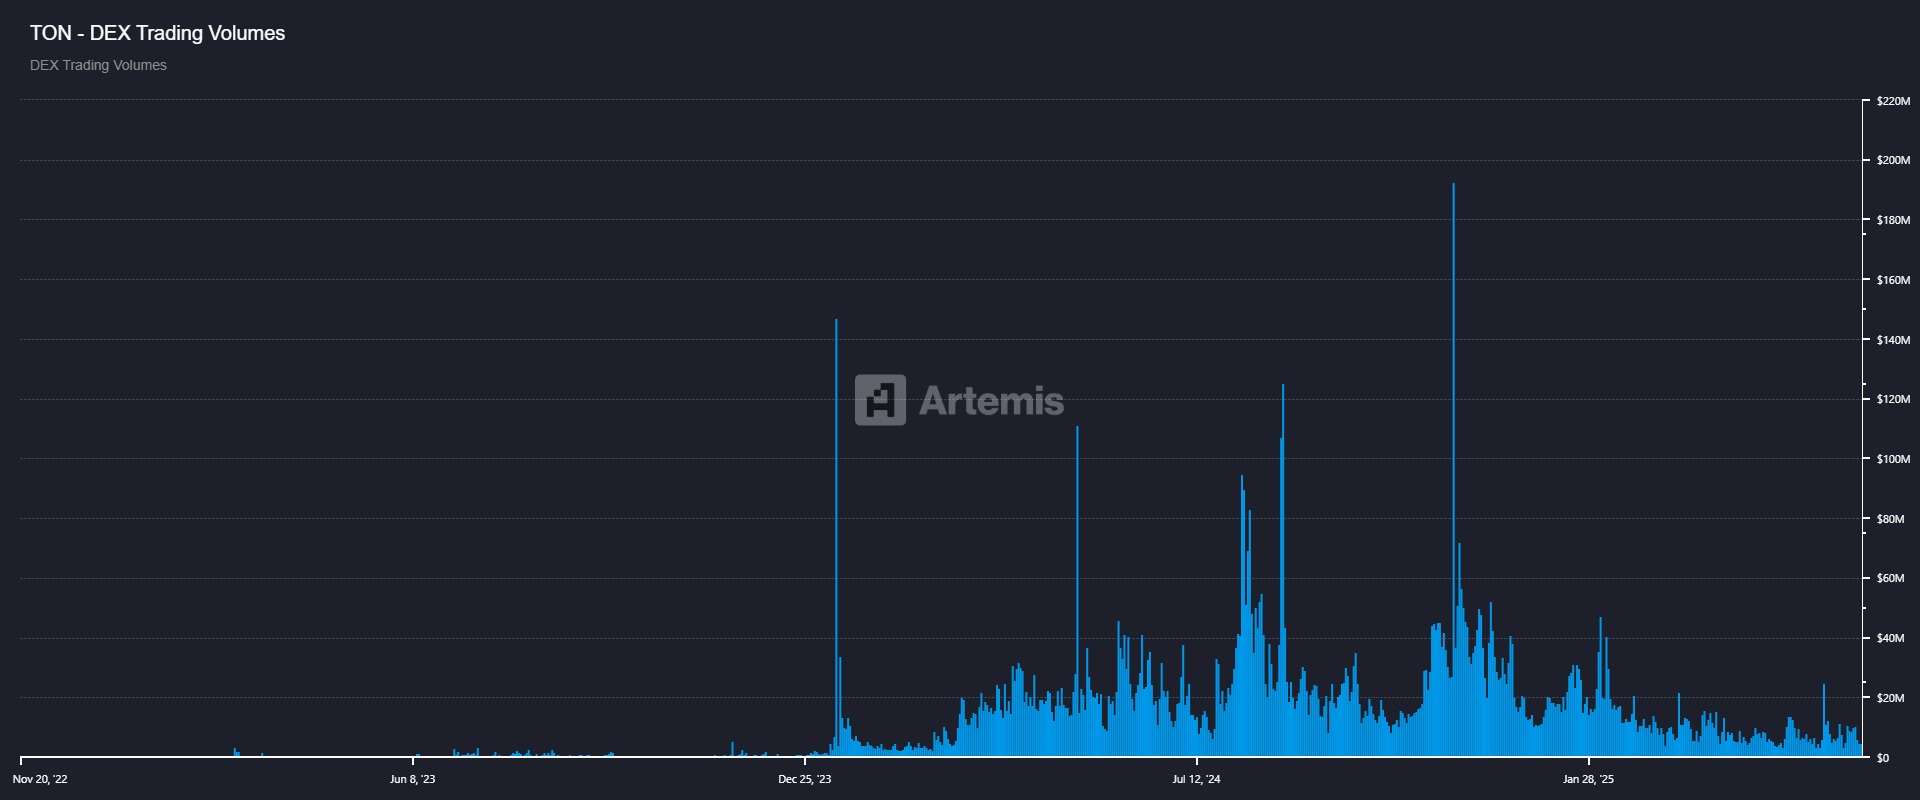
Toncoin’s DEX trading volume chart. Source: Artemis
Cronos Price Forecast: Bears Targeting a 10% crash ahead
Cronos price broke and closed below its ascending trendline (drawn by connecting multiple lows since the end of February) on Friday and declined slightly the following day. On Monday, CRO faced a rejection from its previously trending line, which coincides with the daily resistance level at $0.092, making this a key reversal zone. At the time of writing on Tuesday, it trades at around $0.090.
Sideline traders looking to short CRO can do so between the $0.092 and $0.095 range, with a stop-loss set slightly above its 50-day EMA at $0.096.
If CRO faces correction from the levels mentioned above, it could extend the decline to retest its next daily support at $0.080.
The Relative Strength Index (RSI) on the daily chart reads 38, below its neutral level of 50, indicating strong bearish momentum. Additionally, the Moving Average Convergence Divergence (MACD) indicator also displayed a bearish crossover last week. It also shows a rising red histogram bar below its neutral level, indicating bearish momentum and a downward trend.
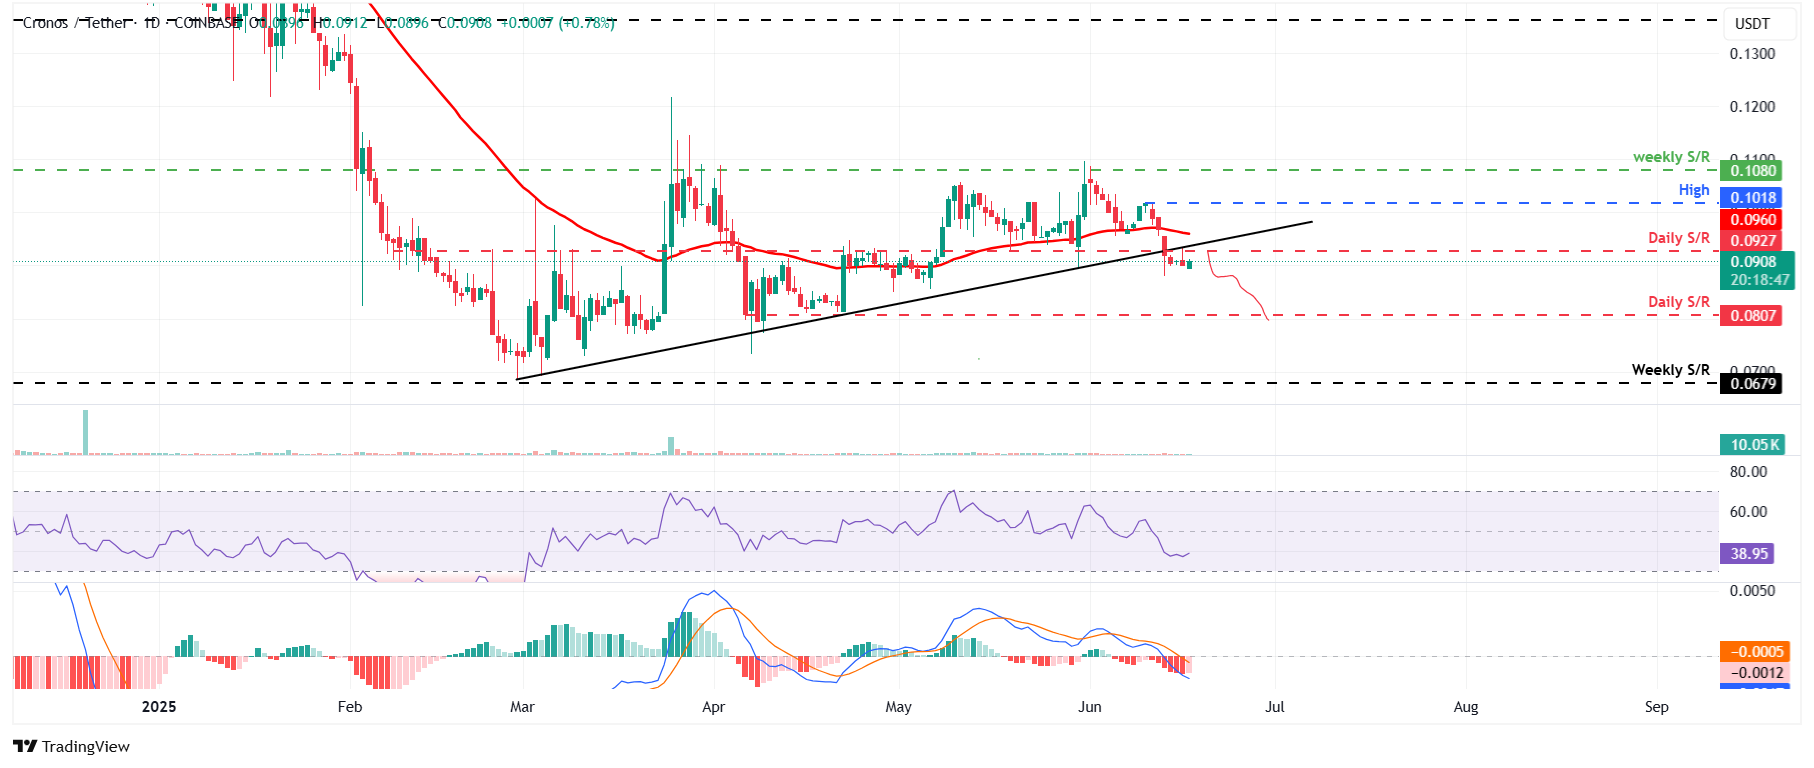
CRO/USDT daily chart
However, if the Cronos price closes above the 50-day EMA at $0.096, the bearish thesis would be invalidated. Such a scenario could extend the rally toward the June 10 high of $0.101.
Toncoin Price Forecast: TON bearish momentum gaining traction
Toncoin price broke and closed below the ascending trendline (drawn by connecting multiple low levels since mid-March) on Friday and declined by nearly 3% the following day. TON price stabilized around the $2.95 level in the next two days. At the time of writing on Tuesday, it continues to trade at around $2.98.
Sideline investors looking to short TON can do so between the $3 and $3.15 range, with a stop-loss set slightly 2% to 3% above its 50-day EMA at $3.15.
If TON faces a pullback from the levels mentioned above, it could extend the decline to retest its April 14 low of $2.65.
The RSI on the daily chart reads 41, below its neutral level of 50, indicating strong bearish momentum. Additionally, the MACD indicator also displayed a bearish crossover last week. It also shows a rising red histogram bar below its neutral level, indicating bearish momentum and a downward trend.
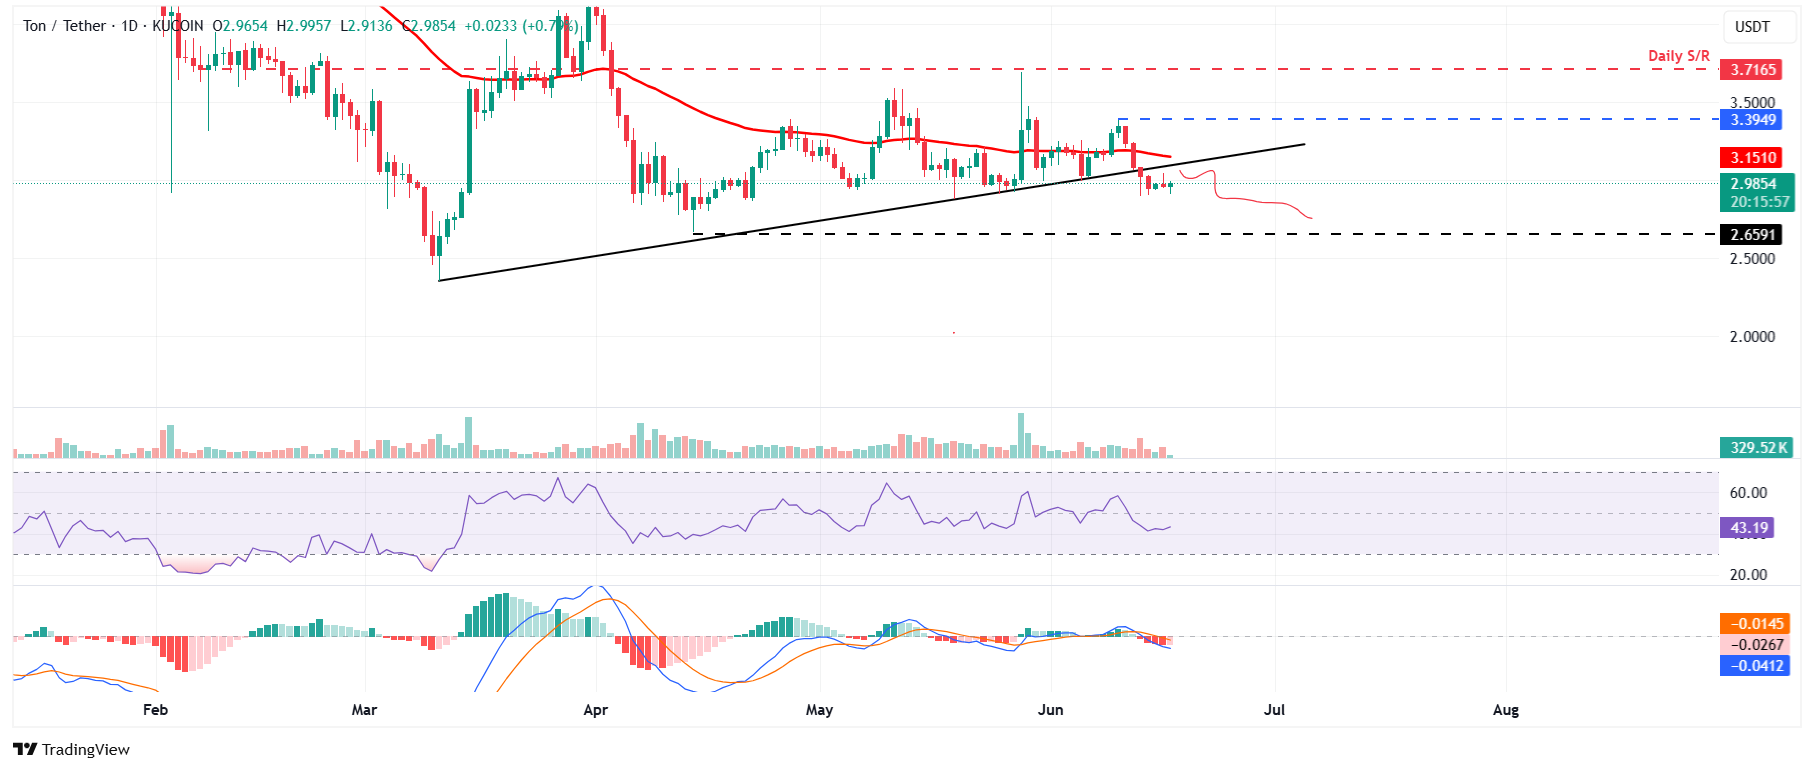
TON/USDT daily chart
On the other hand, if the Toncoin price closes above the 50-day EMA at $3.15, the bearish thesis would be invalidated. Such a scenario could extend the rally toward the June 10 high of $3.39.
Author

Manish Chhetri
FXStreet
Manish Chhetri is a crypto specialist with over four years of experience in the cryptocurrency industry.


