Pepe is extending higher within a projected bullish impulse as anticipated

Cryptocurrency PEPE is moving nicely as expected since we shared an article here on FXstreet back on February 09, where we spotted nice and clean bullish pattern with inverted head&shoulders pattern. CLICK HERE.
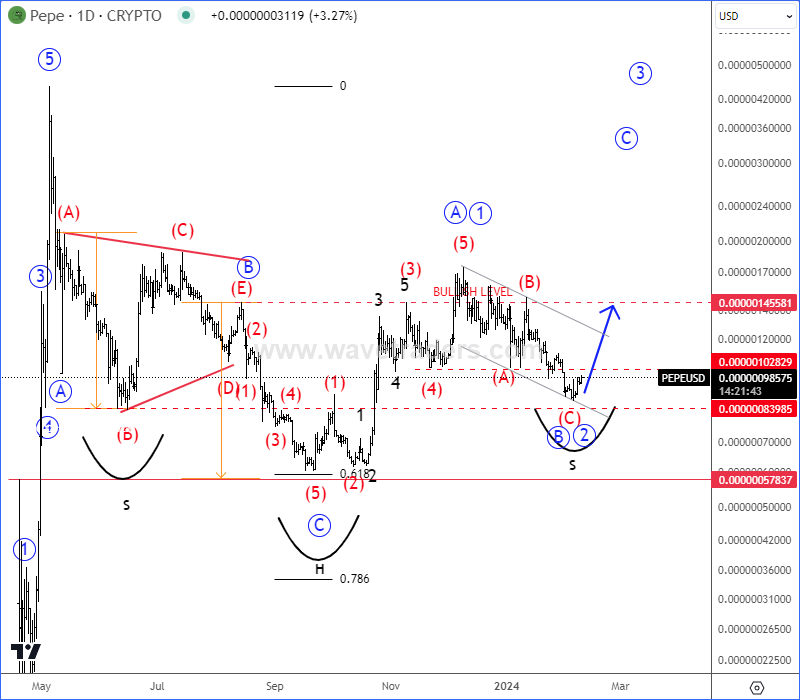
PEPE Daily Chart From February 09
Later in March PEPE went massively up as expected, where we mentioned and highlighted an ongoing strong five-wave bullish impulse. We were actually tracking final stages of subwave (5) of 3.
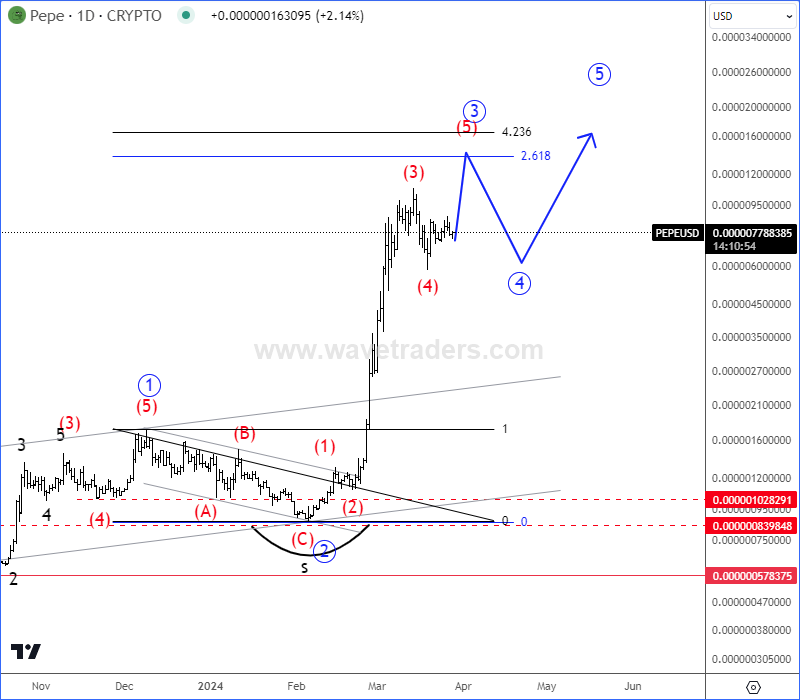
PEPE Daily Chart From March 28
Later on April 18 we got that three-wave A-B-C corrective pullback within a higher degree wave 4 correction, right into ideal 38,2% Fibo. support, from where we expected a bullish continuation for wave 5.
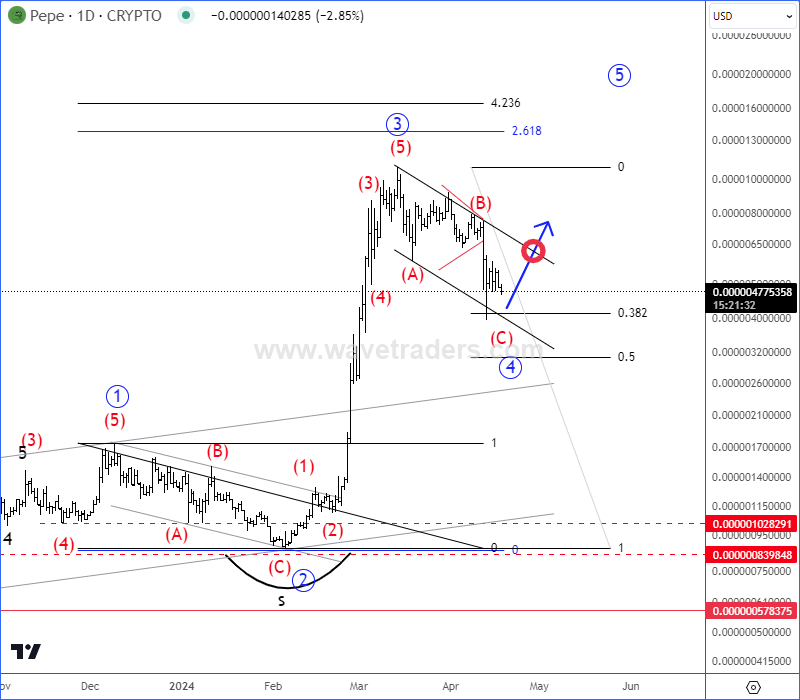
PEPE Daily Chart From April 18
As you can see later on May 03, PEPE confirmed a completed wave 4 correction with a broken channel resistance line, so it was clear that wave 5 is already in progress.
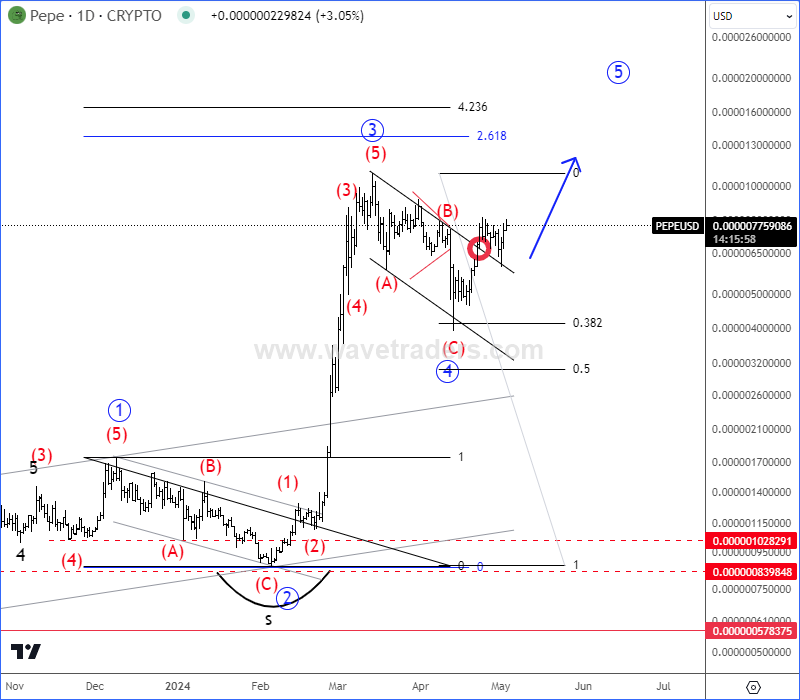
PEPE Daily Chart From May 03
Today on May 30, PEPE is already at the highs for wave 5 as anticipated, but there can be still space up to 0,000020 – 0,000030 target area before it finds the top.
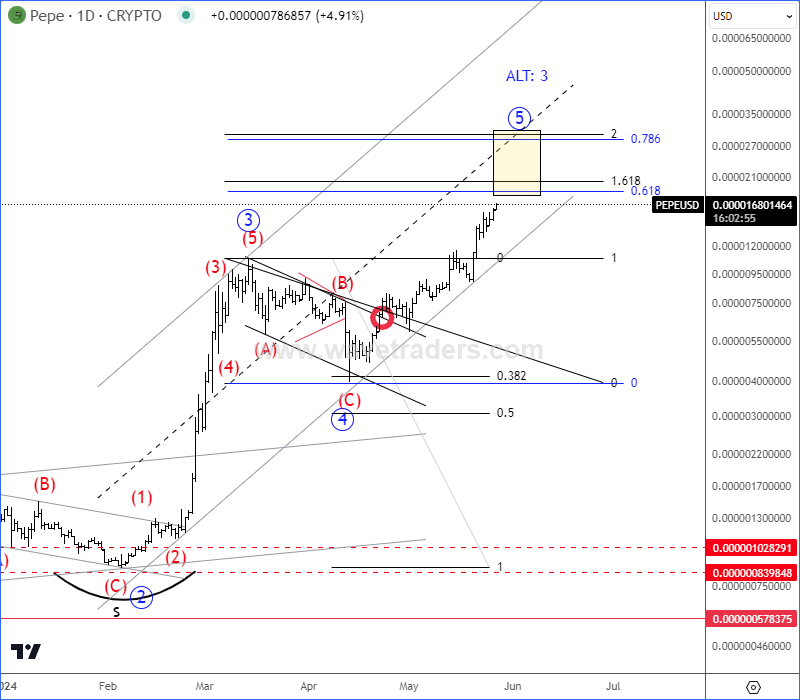
PEPE Daily Chart From May 28
Get Full Access To Our Premium Elliott Wave Analysis For 14 Days. Click here.
Get Full Access To Our Premium Elliott Wave Analysis For 14 Days. Click here.
Author

Gregor Horvat
Wavetraders
Experience Grega is based in Slovenia and has been in the Forex market since 2003.


