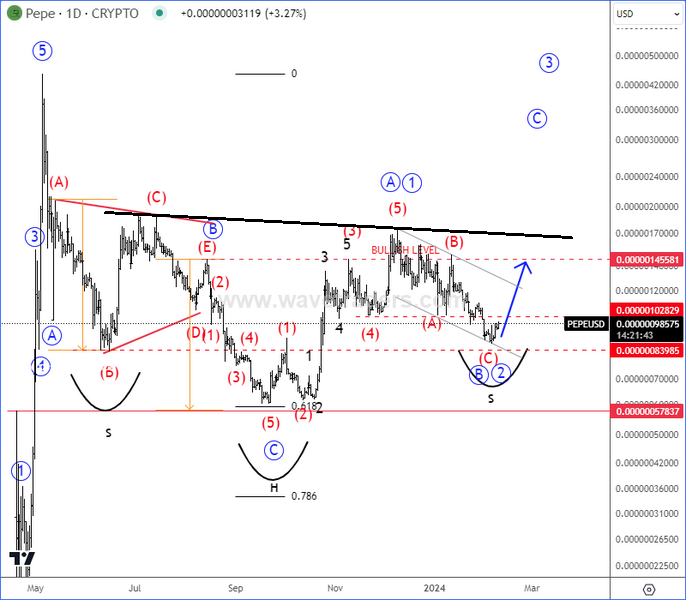
Elliott Wave pattern suggests that PEPE/USD can resume higher

PEPE has completed a larger degree corrective wave labeled (A)-(B)-(C), where wave (C) has potentially ended after it came out of a wave B triangle pattern. So looks like pullback from 2023 highs can be finished, especially as recovery from September/October came higher in five waves. Therefore, it appears that PEPE is in the initial stages of a new uptrend, forming an impulsive wave (1) or alternatively wave (A), with a corrective wave (2) (or B) possibly underway. If the bullish sentiment holds and it breaks above the "BULLISH LEVEL" line, this could confirm a wave (3) up, suggesting a strong continuation of the trend, maybe even back to May 2023 highs. At the same time we are observing the H/S pattern, which is also bullish here and can send prices muhc higher if neckline, near blue wave 1/A high is broken.
Get Full Access To Our Premium Elliott Wave Analysis For 14 Days. Click here.
Get Full Access To Our Premium Elliott Wave Analysis For 14 Days. Click here.
Author

Gregor Horvat
Wavetraders
Experience Grega is based in Slovenia and has been in the Forex market since 2003.


