Only a hail-mary can avert the major XRP bull trap ongoing in Ripple price action
- Ripple price tanks massively this week and pairs back a large part of the incurred gains from last week.
- After breaking the above key indicator, last week's weekly close created a weak spot.
- Although the weekend could hold an upward surprise, the fade still looks the most plausible outcome towards $0.3616 and lower.

Ripple (XRP) price is not having its best moment and is at risk of closing into a very bearish technical play. It all comes down to the fact that XRP price action broke above a very important price cap but could not close above it on Sunday evening. With that, the road is paved for a bull trap and with equity markets officially declared in a bear market, the risk to the downside looks to be 80%, with only a 20% possibility of a turnaround by Sunday evening that is strong enough to avoid that bull trap.
XRP price at risk of fully paring back last week's gains
Ripple price had its best performance of the year with over 30% of gains in the books by the close on Sunday evening. Bulls were partying like in 1999 as the 200-day Simple Moving Average got broken to the upside and look to start a bull run next week. Unfortunately, bulls dropped the ball in the last trading hours on the back of the initial results of the Italian election and slipped below the 200-day SMA, offering a weak spot in the price action for bears to use.
XRP price currently is in a bull trap setup, and as long as price action is unable to at least close above that 200-day SMA, price action could further continue to the downside and pair back the incurred gains from last week. Seeing the several tail risks that again escalated this week with the sabotage of the last remaining gas pipeline to Europe and US equities breaking into the bear market territory, there is not much silver lining in the pipeline that could trigger a strong turnaround. Expect thus the move last week to be a false breakout and see price action decline to at least $0.3616 by next week.
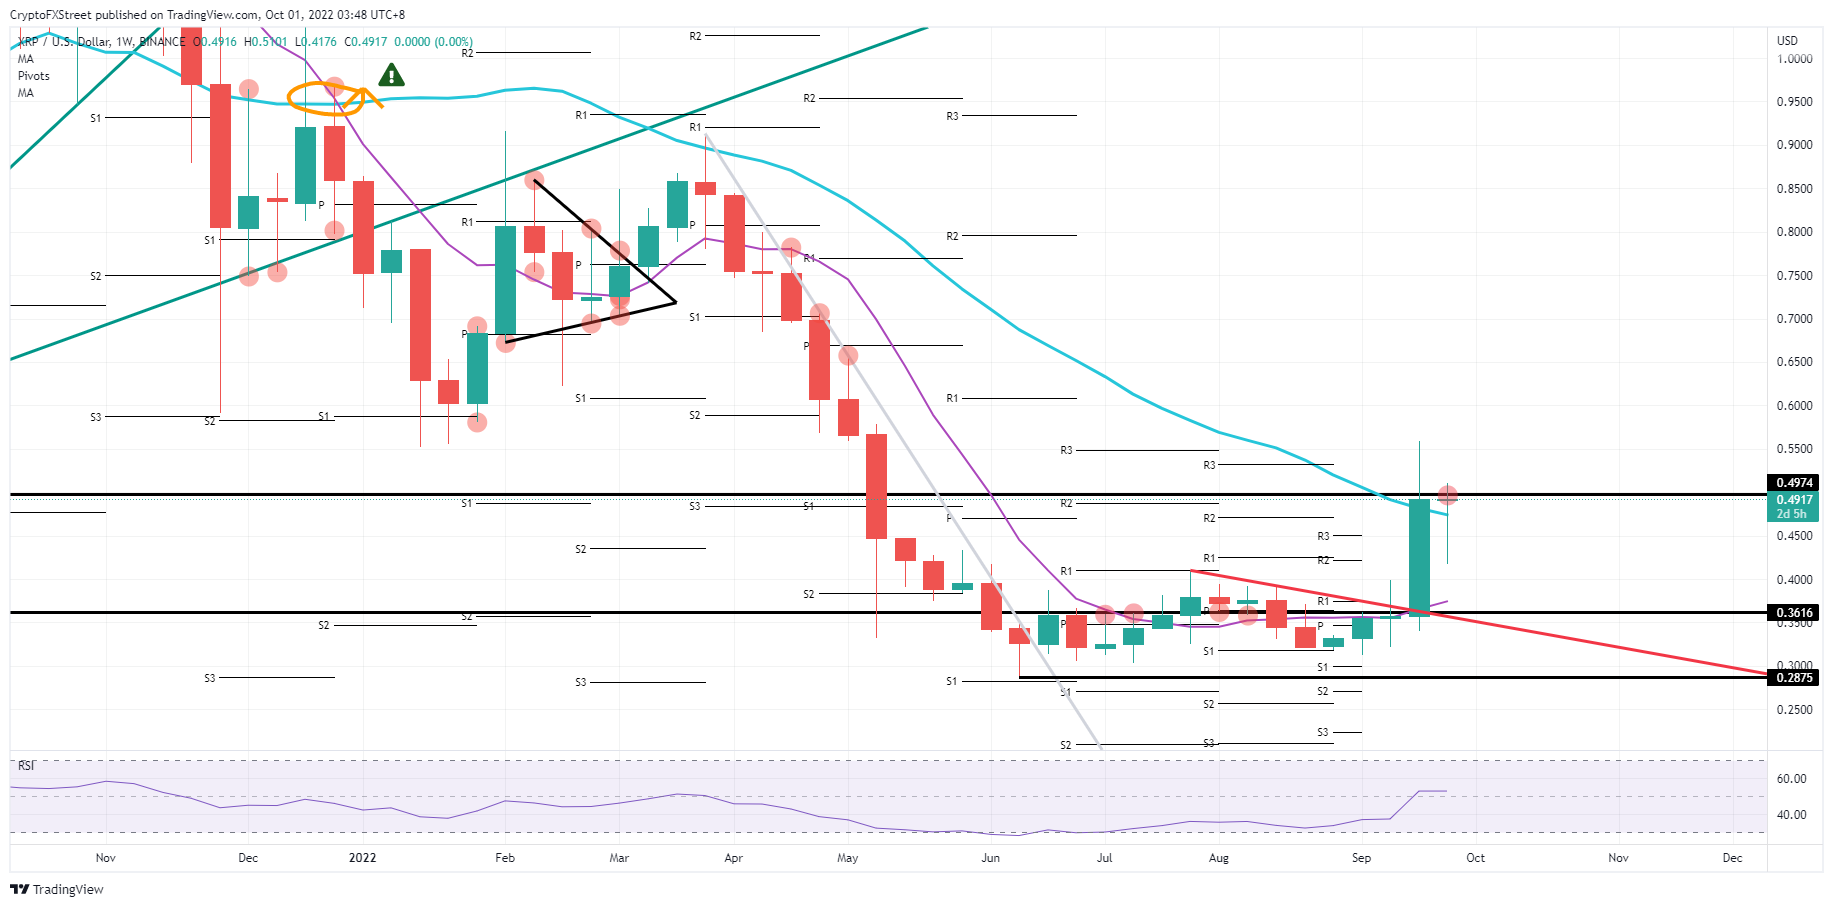
XRP/USD Daily chart
Should price action reverse by Sunday evening and pop back above $0.48, expect the pop from last week to see some follow-through going into next week. Expect that $0.4974 to be challenged and needs to be broken to the upside for a continuation of the rally. On the topside, $0.5563 looks the right candidate for a restest of last week's high.
Author

Filip Lagaart
FXStreet
Filip Lagaart is a former sales/trader with over 15 years of financial markets expertise under its belt.


