|

NEO/USD Elliott Wave technical analysis [Video]

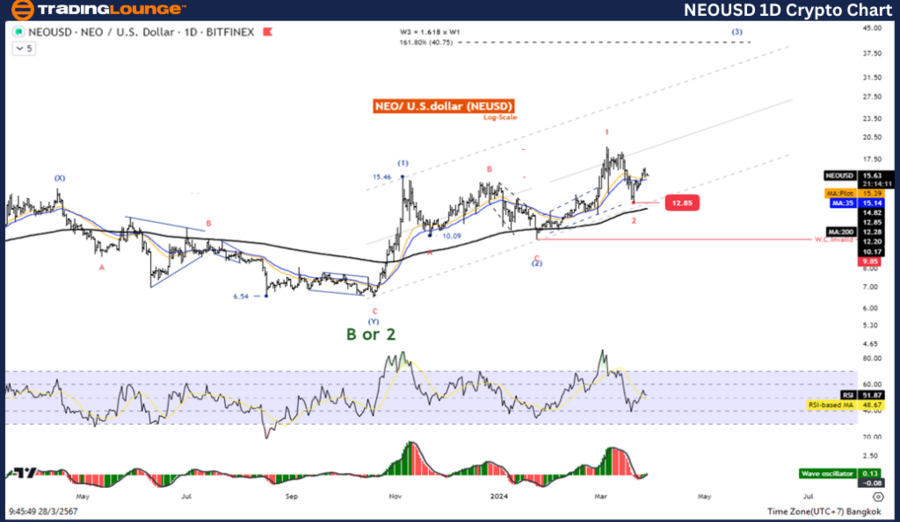
NEO/USD Elliott Wave technical analysis

Function: Follow Trend.

Mode: Motive.

Structure: Impulse.

Position: Wave (3).

Direction Next higher Degrees: Wave ((3)) of Impulse.

Wave Cancel invalid Level: 9.85.

Details: Wave (3) is Equal to 161.8% of Wave (1) at 24.52.

NEO/USD trading strategy

NEO is still in an uptrend from Prices remain in the third wave price structure. We expect the price to test the 40.75 level, which is 161.8% of the length of the first wave. So look for opportunities to join the uptrend.

NEO/ U.S. dollar(NEOUSD)Technical Indicators: The price is above the MA200 indicating an Uptrend, Wave Oscillator is a bullish Momentum.
Chart

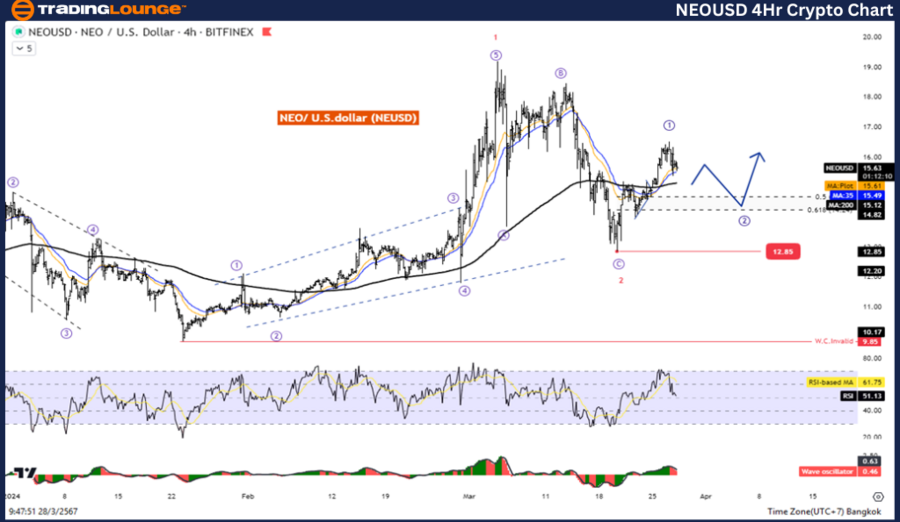
NEO/USD Elliott Wave technical analysis

Function: Counter Trend.

Mode: Corrective.

Structure: Zigzag.

Position: Wave (C).

Direction Next higher Degrees: Wave ((2))) of Impulse.

Wave Cancel invalid Level: 9.85.

Details: The Wave ((2)) is equal to 61.8% of Wave ((1)) at 14.24.

NEO/USD trading strategy

NEO is still in an uptrend. But there may be a short-term pullback of the second wave at the level of 14.14 before rising again in the third wave. So wait for the correction to complete to rejoin the trend.

NEO/ U.S. dollar(NEOUSD)Technical Indicators: The price is above the MA200 indicating an Uptrend, Wave Oscillator is a bullish Momentum.
Chart

NEO/USD Elliott Wave technical analysis [Video]

Author

Peter Mathers

Peter Mathers

TradingLounge

Peter Mathers started actively trading in 1982. He began his career at Hoei and Shoin, a Japanese futures trading company.


More from Peter Mathers
Share:

Editor's Picks

XRP Price Forecast: XRP trades sideways as Ripple targets 10 million agentic AI transactions
Ripple (XRP) is losing momentum on Thursday, albeit gradually, trading above $1.13. The remittance token tagged a weekly high of $1.16 on Tuesday, with gains mainly attributed to developments on the United States (US) Clarity Act and recent signs that inflation is easing in the world’s largest economy.
Crypto Today: Bitcoin, Ethereum, XRP trim gains despite resilient ETF inflows
Cryptocurrency prices are trending lower on Thursday, pressured by renewed inflation concerns stemming from ongoing tensions between the United States (US) and Iran and persistently elevated Oil prices. Bitcoin (BTC) is approaching short-term support at $65,000, with upside resistance remaining firm at $67,000.
Worldcoin Price Forecast: WLD steadies as multiple bullish signals line up
Woldcoin (WLD) price trades around $0.3838 at press time on Thursday, extending a consolidative tone capped beneath the 50-day Exponential Moving Average (EMA) at $0.4141. WLD token emissions are scheduled to drop by 43% from Friday, reducing supply pressure. Retail activity in WLD derivatives remains firm, with a 40% rise in trading volume and elevated funding rates.
Dogecoin Price Forecast: DOGE nears yearly low as risk appetite fades
Dogecoin (DOGE) extends its decline on Thursday, approaching its yearly low at $0.069 as bearish sentiment continues to weigh on the meme coin. Escalating US-Iran conflict and fresh Houthi threats have dampened risk appetite, weighing on speculative assets such as DOGE. Weakening derivatives metrics and a deteriorating technical outlook suggest a deeper correction if DOGE slips below $0.069.
Bitcoin’s potential recovery in the second half hinges on these 4 catalysts
Bitcoin (BTC) has fallen over 34% in the first half of this year as the King Crypto failed to capitalize on a good semester for risk assets despite the woes from the Iran war.

