NEO Technical Analysis: NEO/USD big downside exposure, after a chunky demand zone was cleared by the bears
- NEO was hammered again on Thursday, dropping some 3.5%, with no signs of a slow down in selling.
- Bears were able to break-down a strong demand zone tracking from $29.35-28.50.

NEO/USD 60-minute chart
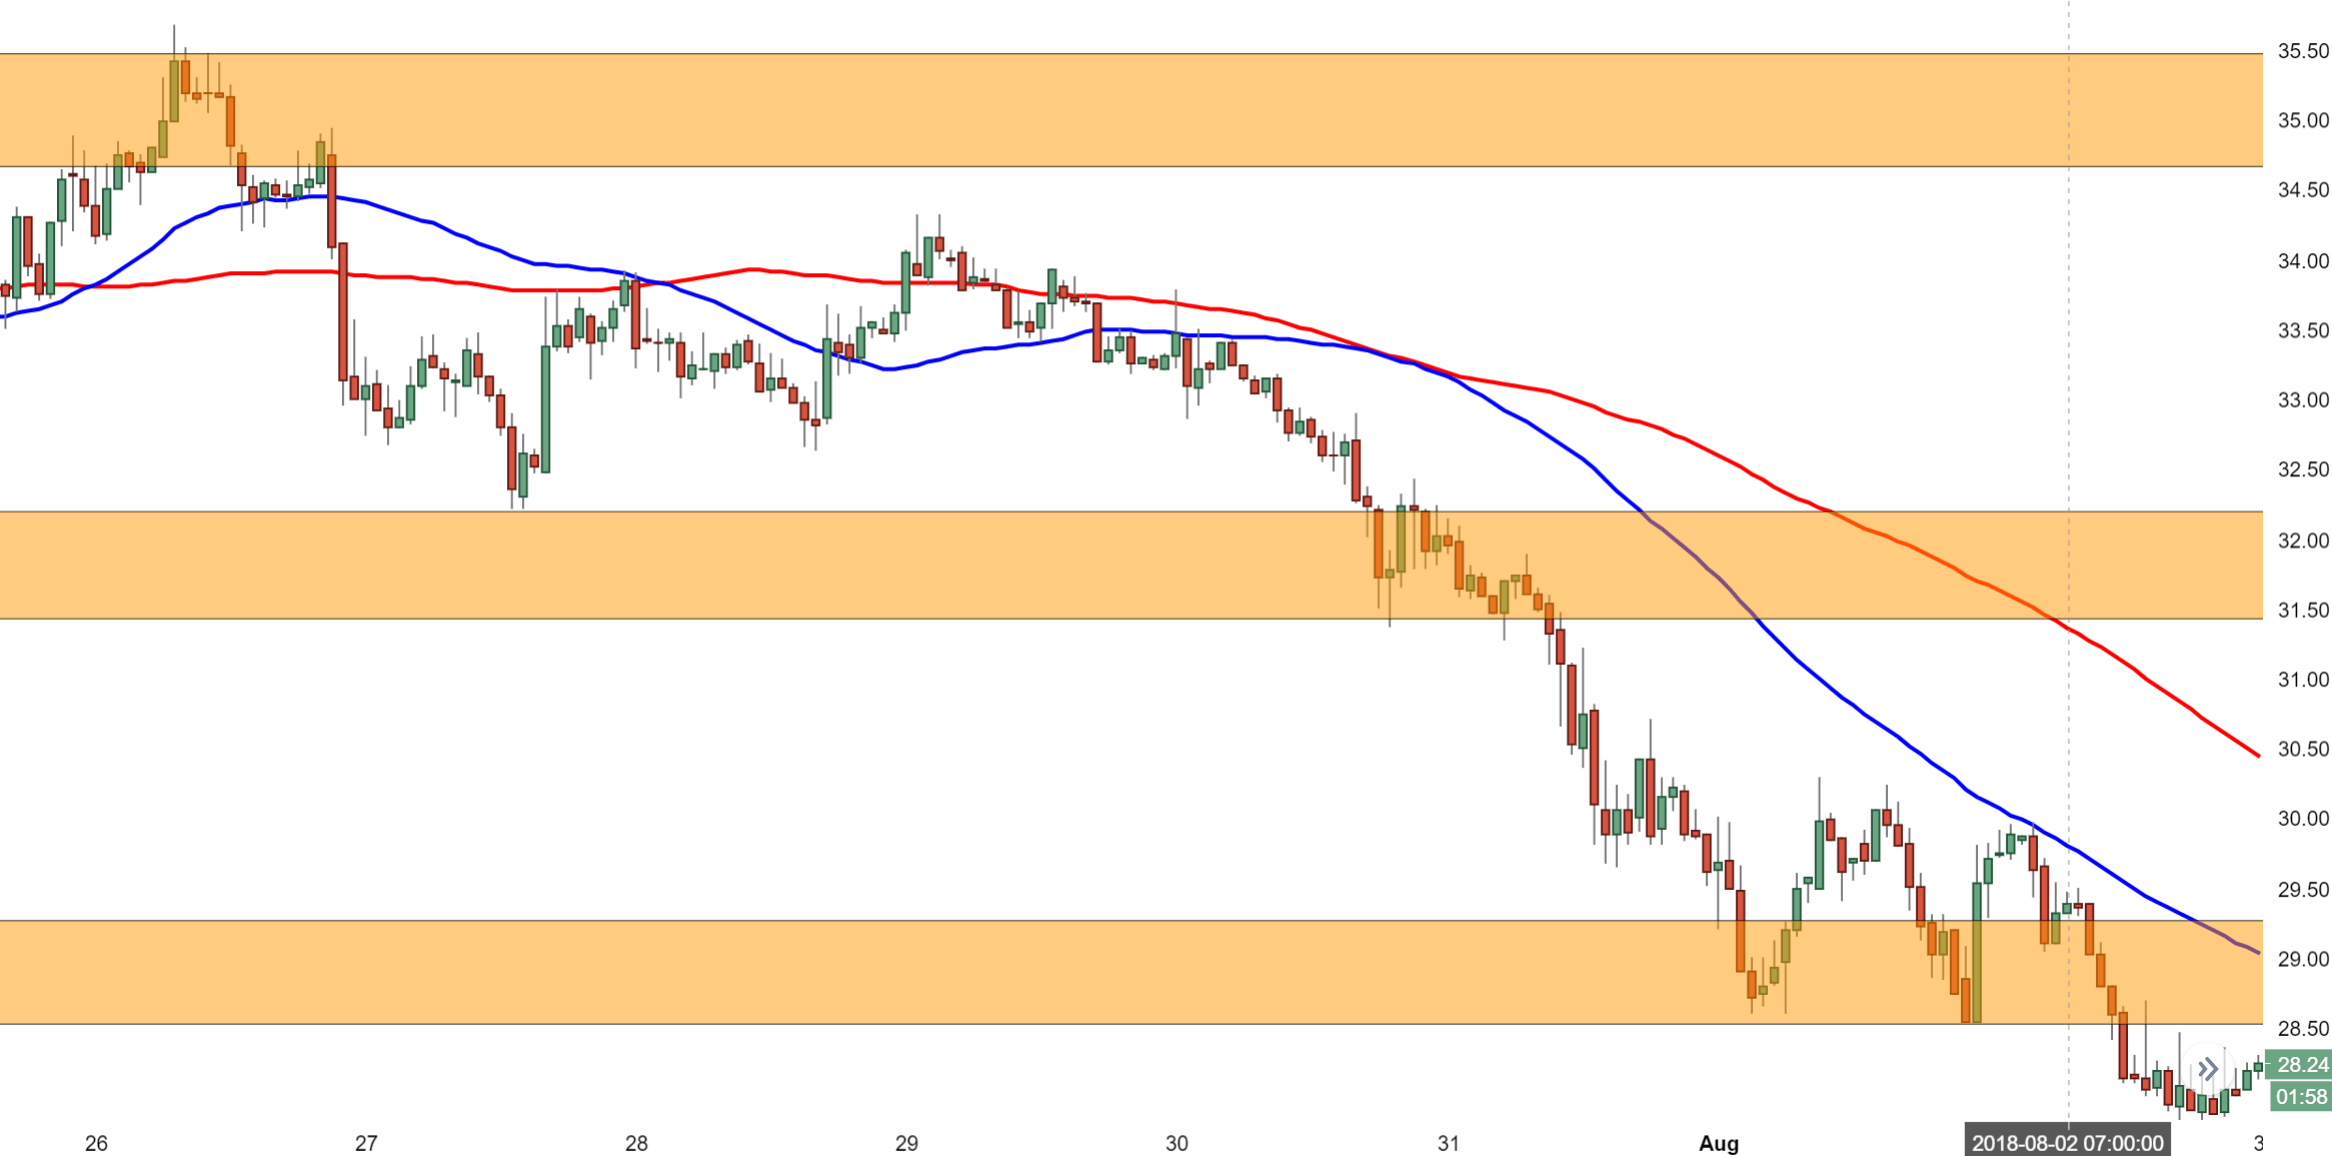
Spot rate: 28.28
Relative change: -3.50%
High: 29.98
Low: 27.28
Trend: Bearish
Support 1: 29.35, entrance of demand zone.
Support 2: 28.50, tail end of key support area.
Support 3: 27.28, today's (Thursday) low.
Resistance 1: 28.90, 50MA.
Resistance 2: 29.90, (resistance on 60-minute chart).
Resistance 3: 30.07, 100MA.
Author

Ken Chigbo
Independent Analyst
Ken has over 8 years exposure to the financial markets. He started his career as an analyst, covering a variety of asset classes; forex, fixed income, commodities and equities.
More from Ken Chigbo


