|

Monero Technical Analysis: Could breaking 90.000 be a step too far?

  • XMR/USD heading to a key psychological and technical level
  • Level matches the 38.2% Fibonacci level
  • Bearish divergence noted in indicator
XMR USD 4 hour chart

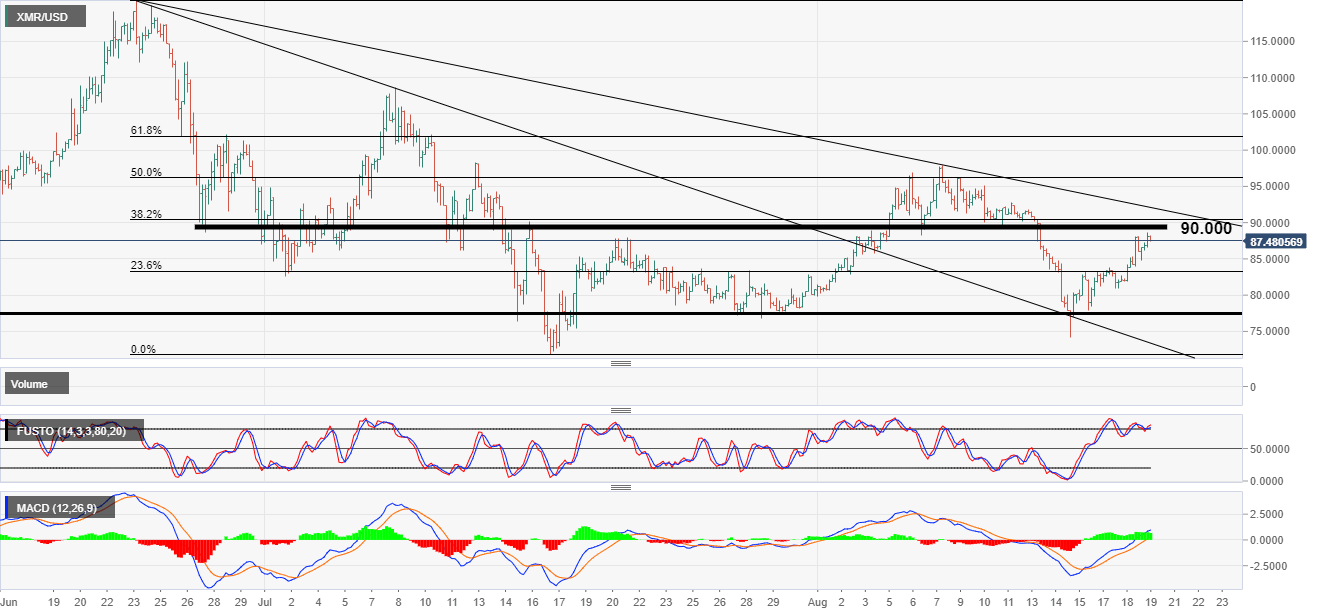
Monero is heading toward a key technical level at 90.000 marked on the 4-hour chart above. Price has made a decent comeback after hitting 74.094 on the downside on August 15th. The 90.00 level matches the 38.2% Fibonacci level marked on the chart. 

The Stochastic indicator recently made a lower high while price made a higher wave high, which could be a bearish signal in the short term. 

The MACD has turned positive as both the histogram and moving averages push over the mid-line. 

On the 1-hour chart below, you can see we have made consecutive higher highs and higher lows leading into the channel formation. As the stochastic divergence kicks in we may head to the lower part of the channel before beaking higher past the resistance. For today the big test will be if the bulls can take out the 90.000 handle.  

XMR USD 1 hour chart

Author

Rajan Dhall, MSTA

Rajan Dhall is an experienced market analyst, who has been trading professionally since 2007 managing various funds producing exceptional returns.

More from Rajan Dhall, MSTA
Share:

Editor's Picks

XRP holds $1.40 amid ETF inflows and stable derivatives market

Ripple trades under pressure, with immediate support at $1.40 holding at the time of writing on Tuesday. A recovery attempt from last week’s sell-off to $1.12 stalled at $1.54 on Friday, leading to limited price action between the current support and the resistance.

Crypto Today: Crypto market holds $2.4 trillion as bearish sentiment persists around Bitcoin, Ethereum, XRP 

The Crypto King, Bitcoin, is constrained below $70,000, with the price holding around $69,000. Altcoins, including Ethereum and Ripple, exhibit technical weakness but are holding above key support levels at $2,000 and $1.40, respectively.

Aster tests resistance as whale activity, perpetuals volume surge

Aster (ASTER) edges higher by over 7% at press time on Thursday, crossing above its 200-period Exponential Moving Average (EMA) on the 4-hour chart while testing a long-term resistance trendline on the daily.

Bitcoin slips below $69,000 as crypto market shows cautious stabilization

Bitcoin price is nearing the lower consolidation boundary, trading below $69,000 at the time of writing on Tuesday. A breakdown below this key level would suggest a correction toward $60,000. However, institutional and corporate demand support a short-term stabilization in BTC.

Bitcoin Price Annual Forecast: BTC holds long-term bullish structure heading into 2026

Bitcoin (BTC) is wrapping up 2025 as one of its most eventful years, defined by unprecedented institutional participation, major regulatory developments, and extreme price volatility.

Bitcoin: The worst may be behind us

Bitcoin (BTC) price recovers slightly, trading at $65,000 at the time of writing on Friday, after reaching a low of $60,000 during the early Asian trading session. The Crypto King remained under pressure so far this week, posting three consecutive weeks of losses exceeding 30%.