|

Monero Technical Analysis: Bulls testing $70 barrier

XMR/USD Daily Chart

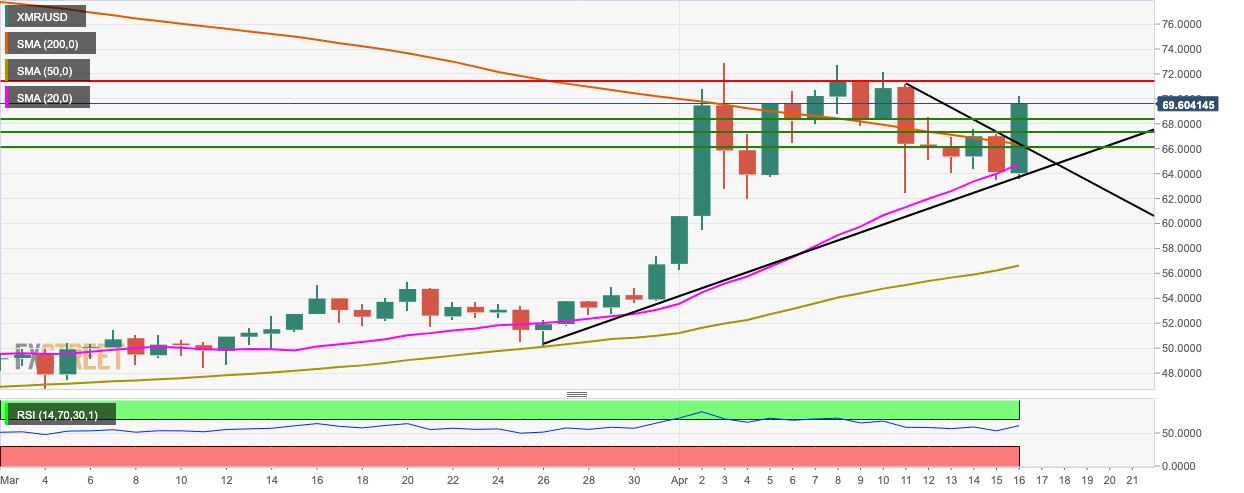
  • XMR/USD went up from $64 to $69.70 as bulls look to test the $70 barrier.
  • The last session took the price above both the 200-day simple moving average (SMA 200) and SMA 20 curves.
  • The relative strength index (RSI) indicator is creeping towards the overbought zone.
  • The daily market has had a bullish breakout from the triangle formation.

XMR/USD 4-Hour Chart

  • The 4-hour market has had a bullish breakout from the red cloud of the Ichimoku indicator.
  • The red cloud shows increased bearish sentiment in the near future.
  • The last three sessions of the Elliot wave oscillator are bullish following five consecutive bearish sessions.

XMR/USD Hourly Chart

  • The XMR/USD hourly chart was able to go above the upper curve of the 20-day Bollinger band before the bears brought the price back inside.
  • The Bollinger band indicates an increasingly volatile market.
  • The 20-day simple moving average (SMA 20) curve has crossed over the SMA 50 curve and is looking to converge with the SMA 200 curve.
  • The RSI indicator is trending barely inside the overbought zone.

Key Levels

XMR/USD

Overview
Today last price69.5621
Today Daily Change5.4381
Today Daily Change %8.48
Today daily open64.124
 
Trends
Daily SMA2063.987
Daily SMA5056.2293
Daily SMA10051.6576
Daily SMA20066.5653
Levels
Previous Daily High67.196
Previous Daily Low63.5467
Previous Weekly High72.7347
Previous Weekly Low62.5115
Previous Monthly High57.3927
Previous Monthly Low46.7996
Daily Fibonacci 38.2%64.9407
Daily Fibonacci 61.8%65.8019
Daily Pivot Point S162.7151
Daily Pivot Point S261.3063
Daily Pivot Point S359.0659
Daily Pivot Point R166.3644
Daily Pivot Point R268.6048
Daily Pivot Point R370.0137

Author

Rajarshi Mitra

Rajarshi Mitra

Independent Analyst

Rajarshi entered the blockchain space in 2016. He is a blockchain researcher who has worked for Blockgeeks and has done research work for several ICOs. He gets regularly invited to give talks on the blockchain technology and cryptocurrencies.

More from Rajarshi Mitra
Share:

Editor's Picks

Ripple exposed to volatility amid low retail interest, modest fund inflows

Ripple (XRP) is extending its intraday decline to around $1.40 at the time of writing on Monday amid growing pressure from the retail market and risk-off sentiment that continues to keep investors on the sidelines.

Crypto Today: Bitcoin steadies around $70,000, Ethereum and XRP remain under pressure 

Bitcoin hovers around $70,000, up near 15% from last week's low of $60,000 despite low retail demand. Ethereum delicately holds $2,000 support as weak technicals weigh amid declining futures Open Interest.

Pi Network extends decline as steady mainnet migration adds pressure

PI edges lower by over 3% at press time on Monday, marking a third consecutive day of losses. The declining trend in PI aligns with the steady mainnet migration of PI tokens, which may fuel selling pressure. The technical outlook for PI remains bearish, with bearish momentum persisting. 

Bitcoin slips below $70,000 as ETF outflows, realized losses fuel bearish outlook

Bitcoin price trades in red below $70,000 on Monday after correcting nearly 9% in the previous week. US-listed spot ETFs recorded a $318 million weekly outflow, marking the third consecutive week of withdrawals.

Bitcoin Price Annual Forecast: BTC holds long-term bullish structure heading into 2026

Bitcoin (BTC) is wrapping up 2025 as one of its most eventful years, defined by unprecedented institutional participation, major regulatory developments, and extreme price volatility.

Bitcoin: The worst may be behind us

Bitcoin (BTC) price recovers slightly, trading at $65,000 at the time of writing on Friday, after reaching a low of $60,000 during the early Asian trading session. The Crypto King remained under pressure so far this week, posting three consecutive weeks of losses exceeding 30%.