MATIC price locked in a tight range before Polygon retests all-time highs
- MATIC price is experiencing a period of stagnation while buyers struggle to lift prices higher against the overpowering distribution of the sellers.
- Polygon is consolidating in a tight range between the 50 four-hour moving average and the 100 four-hour moving average.
- While volatility remains low as the Bollinger bands are witnessing a squeeze, a spike in buying pressure could unravel a bullish thesis.

MATIC price has seen a big run in 2021, surging by over 15,500% year-to-date to reach an all-time high at $2.69. Polygon is down by roughly 35% from the record high while it recovers from the recent crypto market crash.
MATIC price consolidates following a prolonged rally
MATIC price has risen by over 140% from its crash lows and is now met with indecision among investors. Ambivalence seen in the Polygon price action could be due to general volatility or downward pressure from a prolonged rally that has lasted since the start of the year.
On the 4-hour chart, MATIC price appears to be stuck between a tight range, trading between the 50 four-hour moving average as the temporary upper trend line and the 100 four-hour moving average as stiff support.
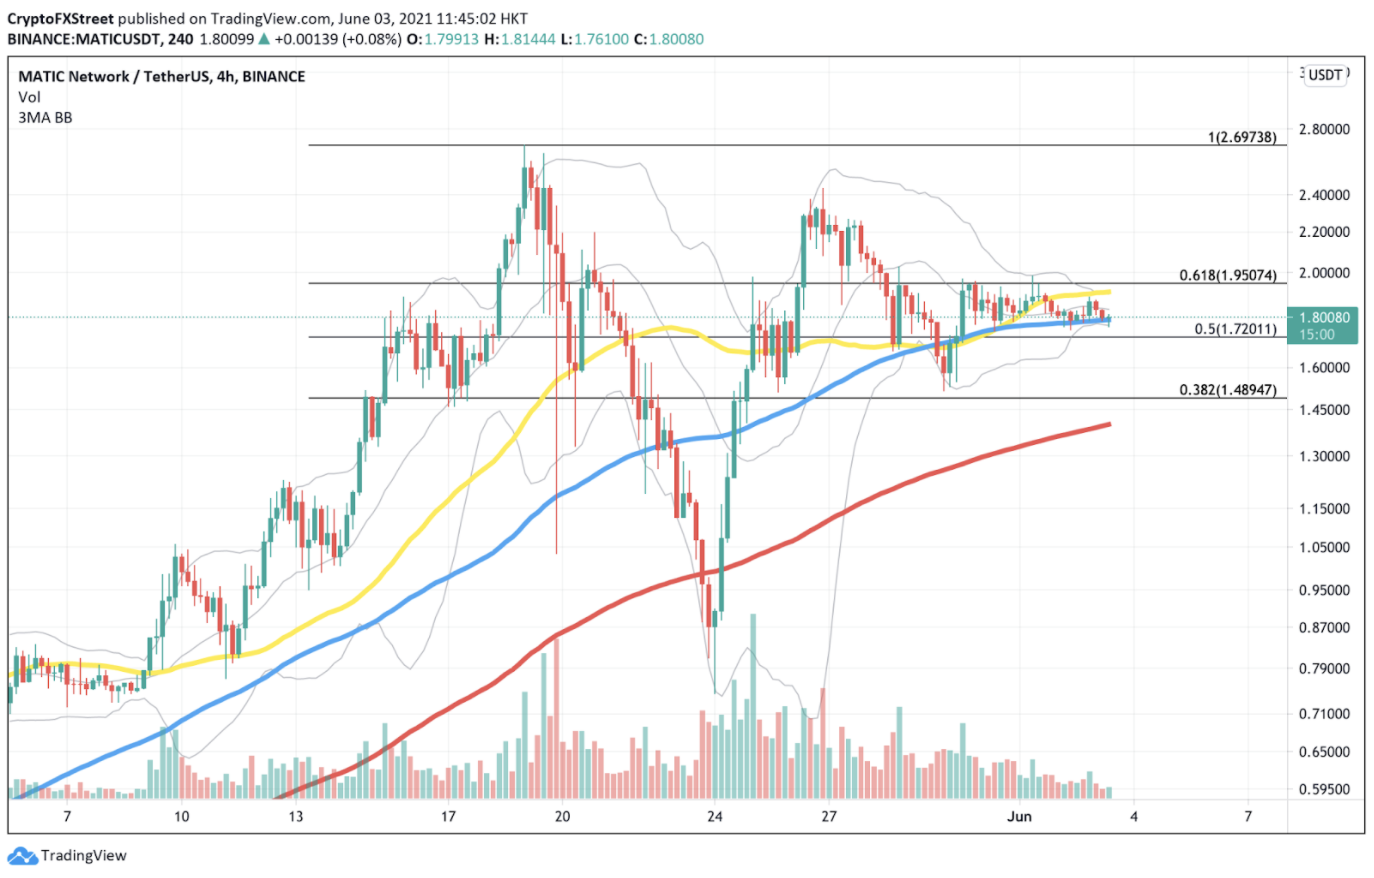
MATIC/USDt 4-hour chart
Although MATIC price has managed to find meaningful support at the 100 four-hour moving average, Polygon faces tremendous obstacles ahead before a bullish thesis could be unraveled.
IntoTheBlock’s In/Out of the Money Around Price (IOMAP) shows that currently, two large clusters are Out of the Money. Over 4,600 addresses bought 151 million MATIC for an average price of $1.84, while the larger cluster with more than 5,600 addresses purchased 130 million Polygon for an average price of $1.87.
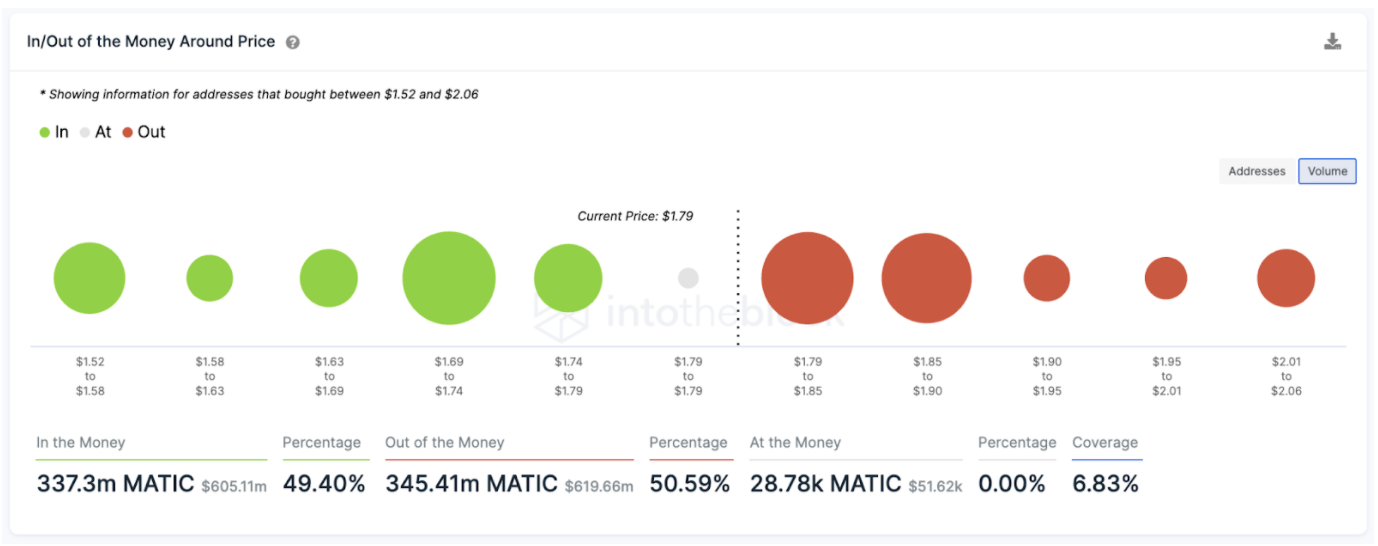
MATIC IOMAP
The data points shown by the IOMAP coincides with the critical resistance area between $1.80 to $1.90, coinciding with the range given by the 50 and 100 four-hour moving averages on the technical analysis.
The next area of interest for MATIC price is the 61.8% Fibonacci extension level at nearly $2 should Polygon manage to break above the 50 four-hour moving average. IOMAP shows little resistance past $1.90, until $2.00.
Investors should also turn their attention to the Bollinger bands squeeze seen in the recent price action, which is indicative of periods of low volatility that are usually succeeded by high volatility. Although this indicator does not give a timeframe of when MATIC price volatility will increase, a spike in buying pressure would put retesting the record high on the radar.
Author

Sarah Tran
Independent Analyst
Sarah has closely followed the growth of blockchain technology and its adoption since 2016.