|

LTC/USD – Forecasting the wave (five) within second dimension correlation

One of the well known facts of the market are correlations between instruments. However that rule does not apply every time in every instrument. Here at Elliott Wave Forecast we call a first degree correlation when 2 instruments move together according to how they are related. For example everyone knows that if the USDX is weak then the counterparts like Gold or Cryptocurrencies need to move in the opposite direction. The opposite is called second dimension correlation. It occurs when the 2 correlated instruments do not move tick by tick the same and deviate the rule of first degree correlation. In this article we will see how we were able to forecast the wave (5) in LTCUSD while other cryptos remained weak.

LTCUSD 1 hour New York update 12.23.22

Chart

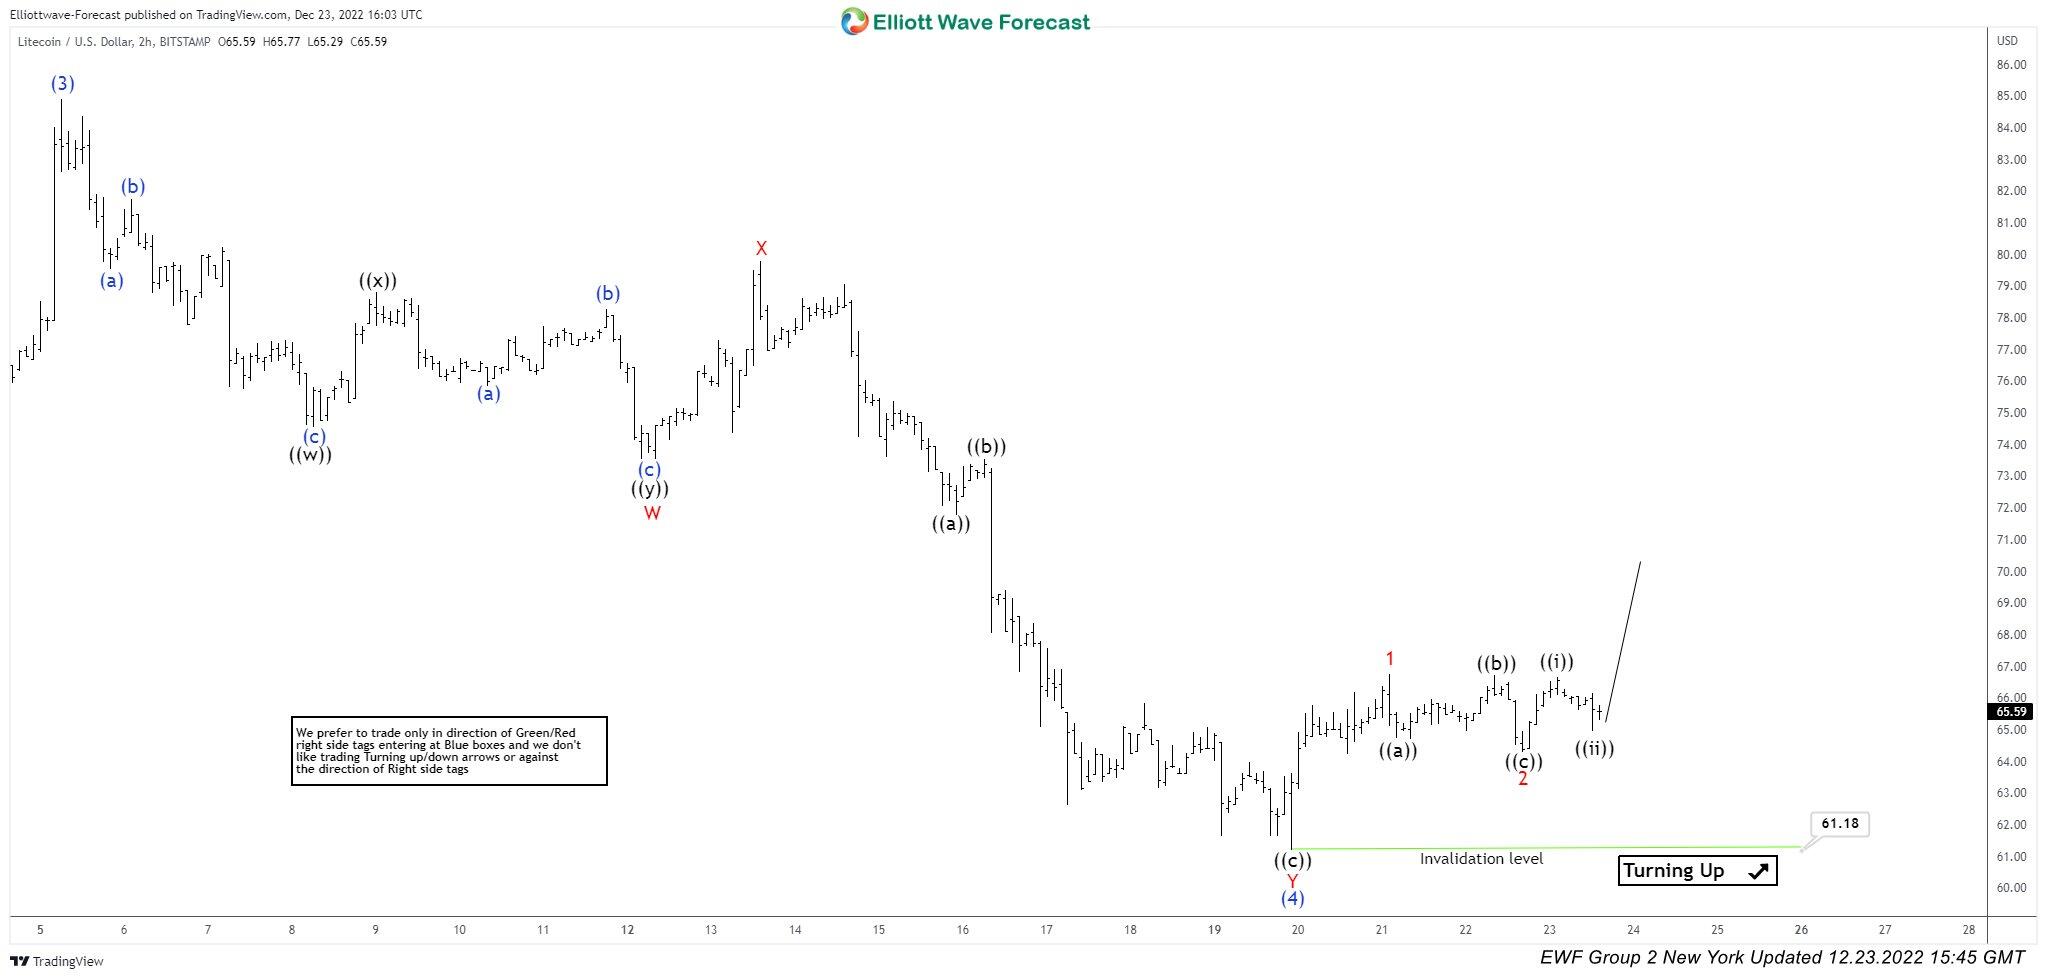
Litecoin was expected to start the next leg higher in wave (5) while above 61.15. While other related instruments were expected to remain weak. LTCUSD made the move higher and currently within wave 3 of (5). Let’s have a look on how it looks today.

LTC 1.10.23 1 hour Asia update

Chart

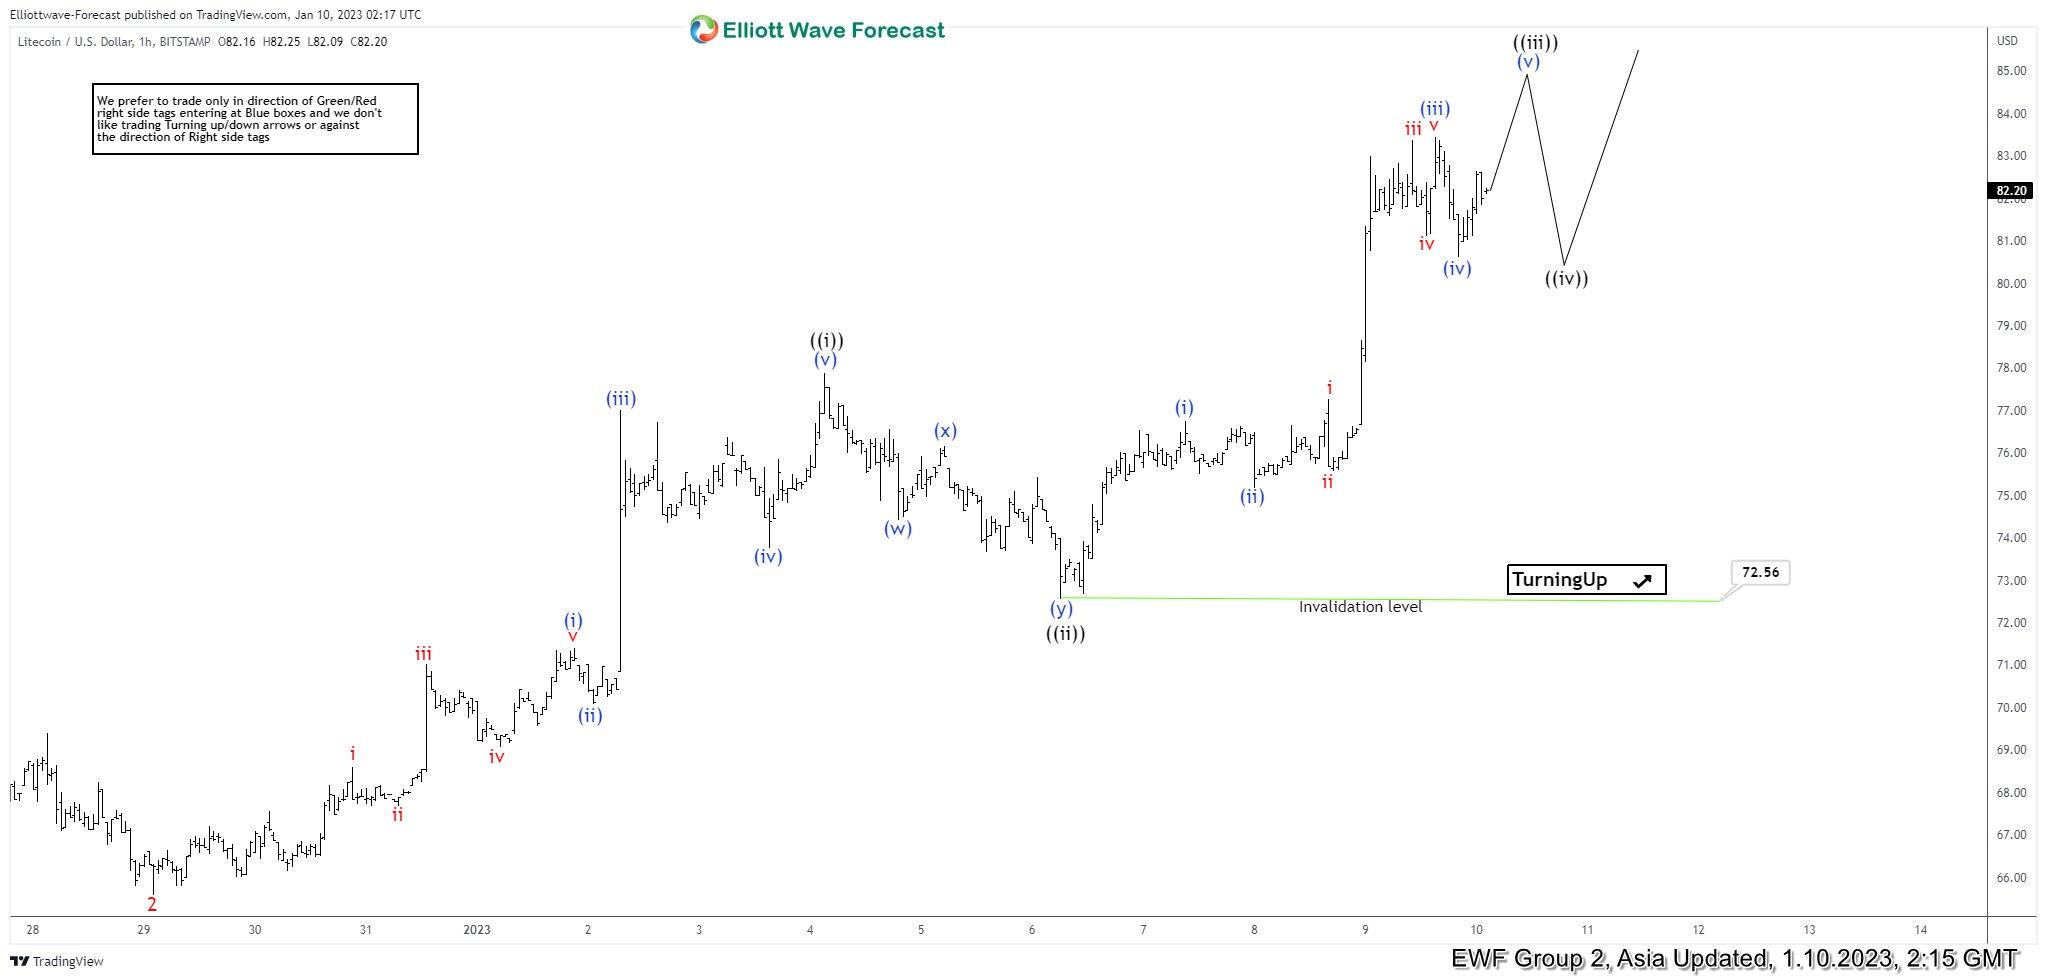
Now Litecoin is extending higher in wave ((iii)) of 3. Pullback soon in wave ((iv)) before ((v)) higher to end wave 3 in red. More upside should continue thereafter. As wave 4 in red pullback should find support for a wave 5 of (5) to end a larger degree cycle.
If you have a look at other related instruments the view looks different. This is because LTCUSD has been reacting in a second dimension correlation within it’s larger degree cycle.

Author

Elliott Wave Forecast Team

Elliott Wave Forecast Team

ElliottWave-Forecast.com

More from Elliott Wave Forecast Team
Share:

Editor's Picks

Crypto Today: Bitcoin, Ethereum, XRP extend decline, pressured by increasing ETF outflows

Cryptocurrencies are trading under pressure on Thursday, weighed down by risk-off sentiment driven by Middle East tensions and macroeconomic uncertainty. Bitcoin has extended its decline below $65,000 and is targeting the key support area at $60,000.

Bitcoin’s massive storm is back: Why the sell-off is far from over

Bitcoin price action over the last few weeks has felt less like a normal, healthy correction and more like a slow grinding crash that continues to wreak havoc on holdings and trading accounts. And everything suggests that the dramatic crash isn’t over.

Hyperliquid and Near Protocol fall sharply as Arthur Hayes dumps HYPE and NEAR for Worldcoin

Hyperliquid (HYPE) and Near Protocol (NEAR) prices have dropped 11% and 17%, respectively, at press time on Thursday, erasing gains as the well-known investor Arthur Hayes dumps HYPE and NEAR holdings.

Pi Network hits record low as market-wide risk-off sentiment weighs

PI price hovers around $0.1300 at press time on Thursday, reflecting a mild rebound from the $0.1186 record low reached earlier on the day. Deposits totaling roughly 1 million PI tokens on exchanges over the last 24 hours suggest waning investor confidence amid a broader market risk-off sentiment.

Billions in ETF outflows don’t bode well
Bitcoin (BTC) remains under pressure, trading below $74,000 on Friday, and is set to post its third consecutive week of losses. The institutional sell-off continues, with spot BTC Exchange-Traded funds (ETFs) recording billions in outflows. In addition, sticky inflation and macroeconomic headwinds suppress the Crypto King’s upside potential. Institutional demand continues to weaken so far this week.