|

Litecoin technical analysis: LTC/USD strings together two heavily bullish days to re-enter $100-zone

  • LTC/USD went up from $79.75 to $102 over the last two days.
  • Elliot oscillator had two straight bullish sessions after two weeks of bearish sessions.

LTC/USD daily chart

fxsoriginal

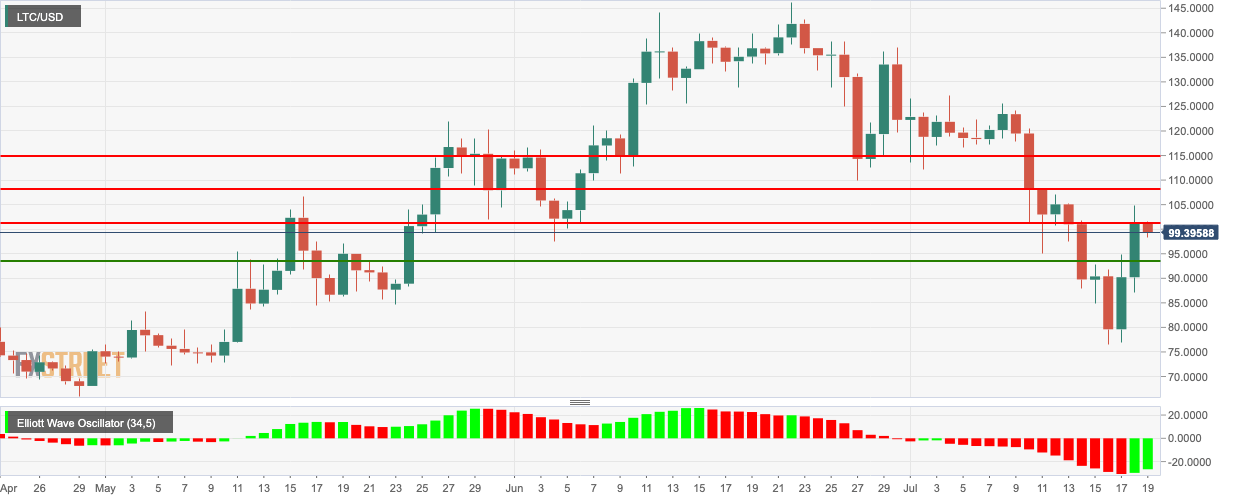
LTC/USD has dropped from $102 to 99.60 in the early hours of Friday after meeting market resistance. Before this, LTC/USD had two heavily bearish days where the price spiked from $79.75 to $102. The Elliot oscillator had two straight bullish sessions after two weeks of bearish sessions.

LTC/USD 4-hour chart

fxsoriginal

The 4-hour price chart shows a bearish breakout from the upward trending line. The price is floating below the green Ichimoku cloud. The relative strength index (RSI) indicator was going into the overbought zone when it bounced down and is currently trending around 63.63.

LTC/USD hourly chart

fxsoriginal

The hourly chart has been trending horizontally and has touched the 20-day simple moving average (SMA 20) curve. The price is still in the upper half of the 20-day Bollinger band. The moving average convergence/divergence show two bearish sessions following ten straight bullish sessions, indicating that the bears are fighting back in the short term.

Key Levels

LTC/USD

Overview
Today last price99.3737
Today Daily Change-1.9090
Today Daily Change %-1.88
Today daily open101.2827
 
Trends
Daily SMA20110.3826
Daily SMA50119.3394
Daily SMA100101.9407
Daily SMA20074.7665
Levels
Previous Daily High104.7412
Previous Daily Low87.128
Previous Weekly High125.6252
Previous Weekly Low95.0808
Previous Monthly High146.2716
Previous Monthly Low97.5782
Daily Fibonacci 38.2%98.0129
Daily Fibonacci 61.8%93.8562
Daily Pivot Point S190.6934
Daily Pivot Point S280.1041
Daily Pivot Point S373.0803
Daily Pivot Point R1108.3066
Daily Pivot Point R2115.3304
Daily Pivot Point R3125.9197


Author

Rajarshi Mitra

Rajarshi Mitra

Independent Analyst

Rajarshi entered the blockchain space in 2016. He is a blockchain researcher who has worked for Blockgeeks and has done research work for several ICOs. He gets regularly invited to give talks on the blockchain technology and cryptocurrencies.

More from Rajarshi Mitra
Share:

Editor's Picks

Ripple bulls defend key support amid waning retail demand and ETF inflows

XRP ticks up above $1.40 support, but waning retail demand suggests caution. XRP attracts $4 million in spot ETF inflows on Thursday, signaling renewed institutional investor interest.

Crypto Today: Bitcoin, Ethereum, XRP rebound as risk appetite improves

Bitcoin rises marginally, nearing the immediate resistance of $68,000 at the time of writing on Friday. Major altcoins, including Ethereum and Ripple, hold key support levels as bulls aim to maintain marginal intraday gains.

Bitcoin Weekly Forecast: No recovery in sight 

Bitcoin price continues to trade sideways between $65,729 and $71,746, extending its consolidation since February 7. US-spot ETFs record an outflow of $403.90 million through Thursday, pointing to the fifth consecutive week of withdrawals.

Pi Network Price Forecast: PI recovery stalls amid profit-taking

Pi Network tests 50-day EMA support on Friday, after a 5% decline the previous day. PiScan data shows large deposits on CEXs totaling over 4 million PI tokens in the last 24 hours, reflecting an exodus of investors taking profits.

Bitcoin Price Annual Forecast: BTC holds long-term bullish structure heading into 2026

Bitcoin (BTC) is wrapping up 2025 as one of its most eventful years, defined by unprecedented institutional participation, major regulatory developments, and extreme price volatility.

Bitcoin: No recovery in sight

Bitcoin (BTC) price continues to trade within a range-bound zone, hovering around $67,000 at the time of writing on Friday, and falling slightly so far this week, with no signs of recovery.