Litecoin Technical Analysis: LTC/USD near-term upside opportunity for the bulls
- Litecoin's on Thursday is trading very marginally lower by just some 0.3%, towards the latter part of the session.
- LTC/USD bulls manage to squeeze above a near-term descending trend line, that was causing minor resistance.

LTC/USD 15-minute chart
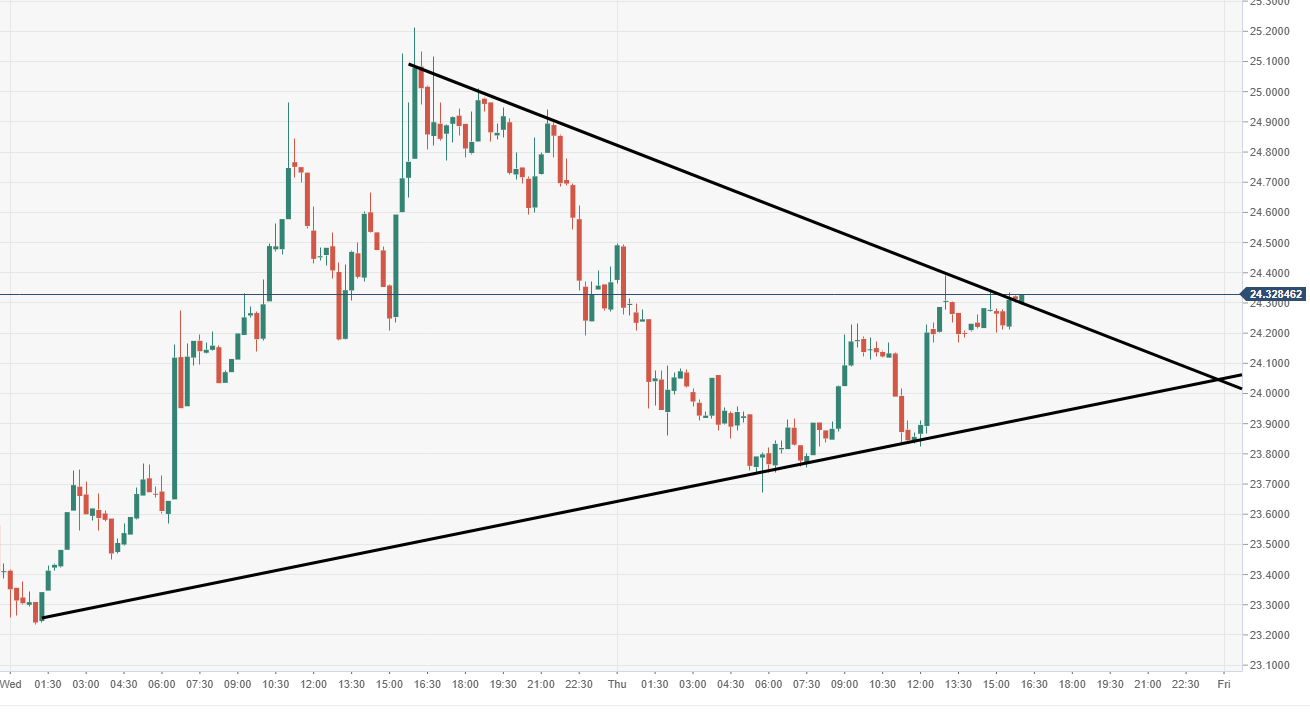
Spot rate: 24.32
Relative change: -0.31%
High: 24.39
Low: 23.67
Trend: Neutral
Support 1: 24.28, breached descending trend line.
Support 2: 23.33, daily pivot point support.
Support 3: 22.29, daily pivot point support.
Resistance 1: 25.31, daily pivot point resistance & supply area.
Resistance 2: 26.25, daily pivot point resistance.
Resistance 3: 27.29, daily pivot point resistance.
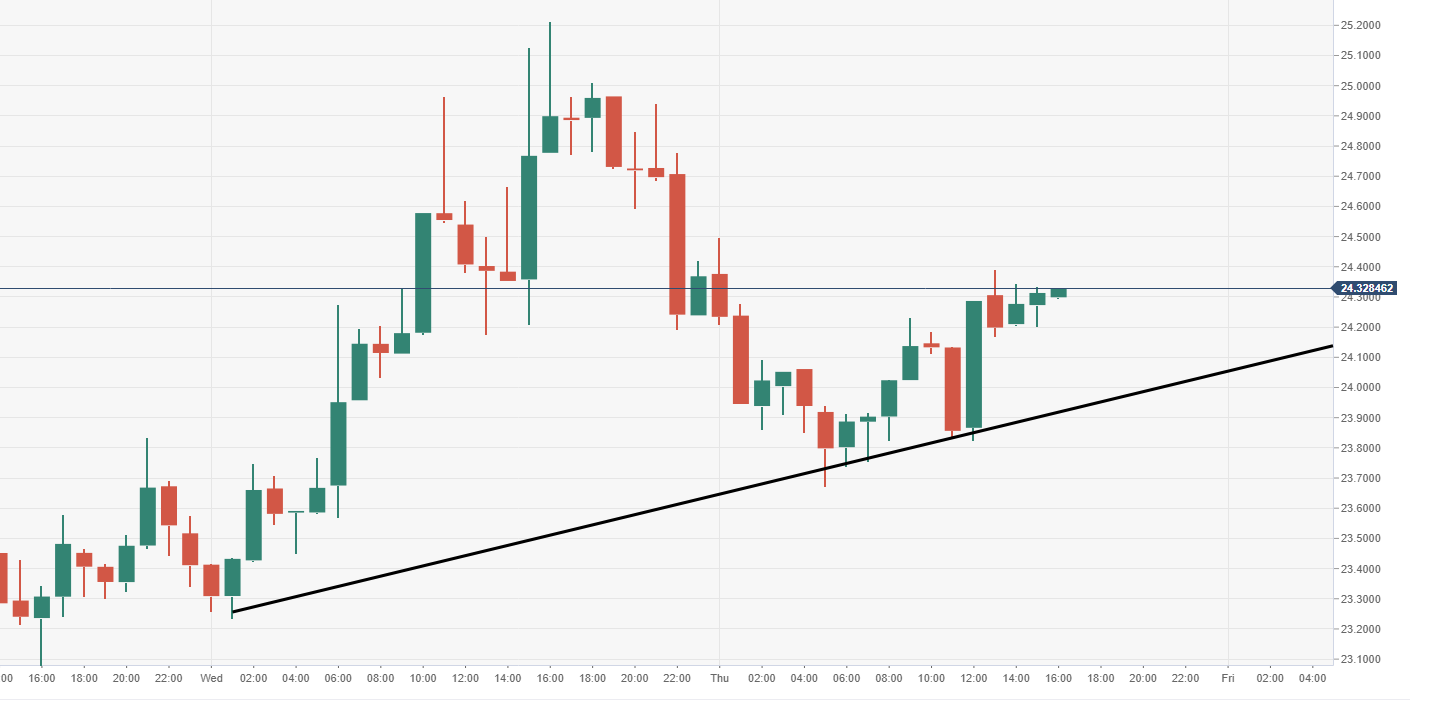
LTC/USD 60-minute chart
- A near-term ascending trend line is providing comfort for the bulls in their attempt of recovery.
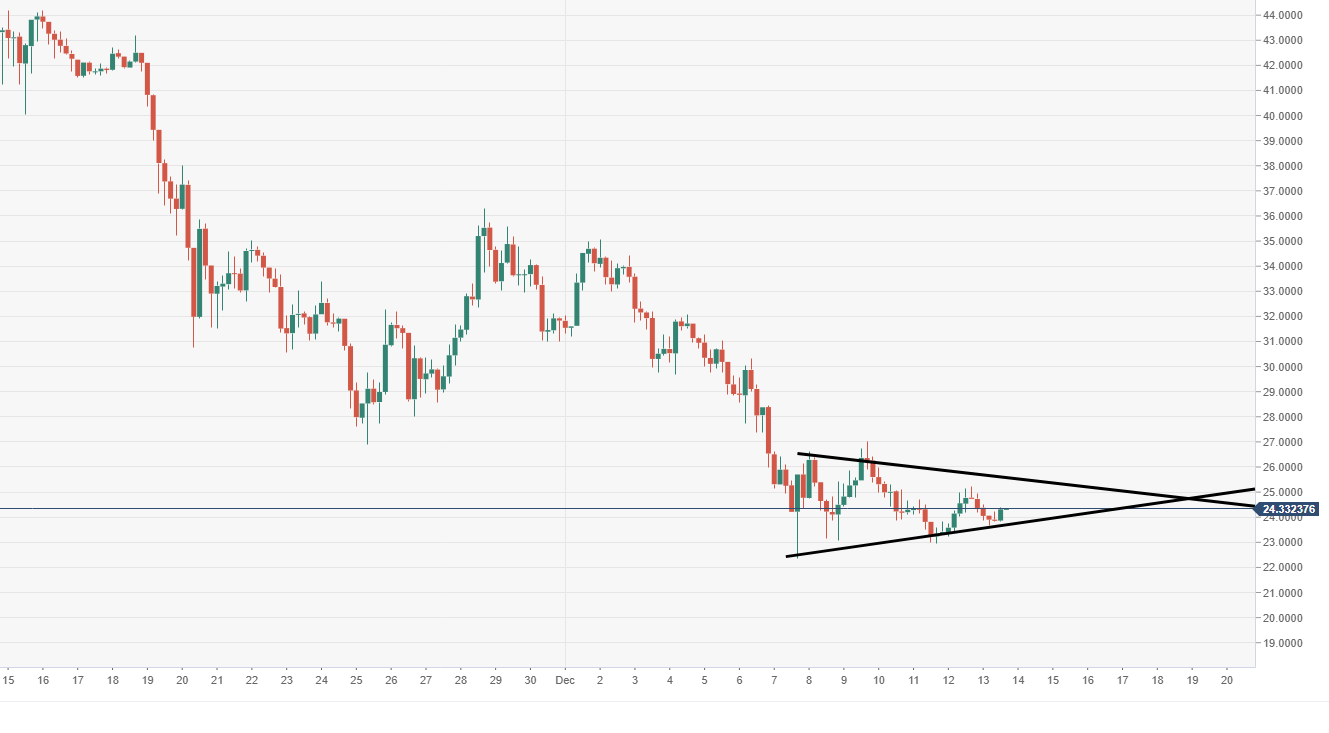
LTC/USD 4-hour chart
- Despite the promising near-term development seen via the 15-minute chart view, price action is still moving within a bearish pennant set up.
Author

Ken Chigbo
Independent Analyst
Ken has over 8 years exposure to the financial markets. He started his career as an analyst, covering a variety of asset classes; forex, fixed income, commodities and equities.


