|

Litecoin Technical Analysis: LTC/USD big bull action, extending out from flag structure

  • Litecoin is outperforming on Wednesday, holding decent gains of 7% in the session. 
  • LTC/USD price action extends to the upside after breaking out from bull flag set up. 

LTC/USD 15-minute chart

  • LTC/USD near-term price action via 15-minute chart produces somewhat of an evening star formation. A bearish candle to follow may signal a near-term pullback. 

Spot rate:                50.69

Relative change:    +7.01%

High:                       52.43

Low:                        46.58

Trend:                      Neutral

Trends:
    Daily SMA20: 39.1756
    Daily SMA50: 35.2522
    Daily SMA100: 34.0048
    Daily SMA200: 45.7334
Levels:
    Previous Daily High: 49.2579
    Previous Daily Low: 46.8979
    Previous Weekly High: 47.3684
    Previous Weekly Low: 40.3348
    Previous Monthly High: 41.4965
    Previous Monthly Low: 29.6396
    Daily Fibonacci 38.2%: 47.7995
    Daily Fibonacci 61.8%: 48.3564
    Daily Pivot Point S1: 46.4174
    Daily Pivot Point S2: 45.4777
    Daily Pivot Point S3: 44.0574
    Daily Pivot Point R1: 48.7773
    Daily Pivot Point R2: 50.1976
    Daily Pivot Point R3: 51.1373

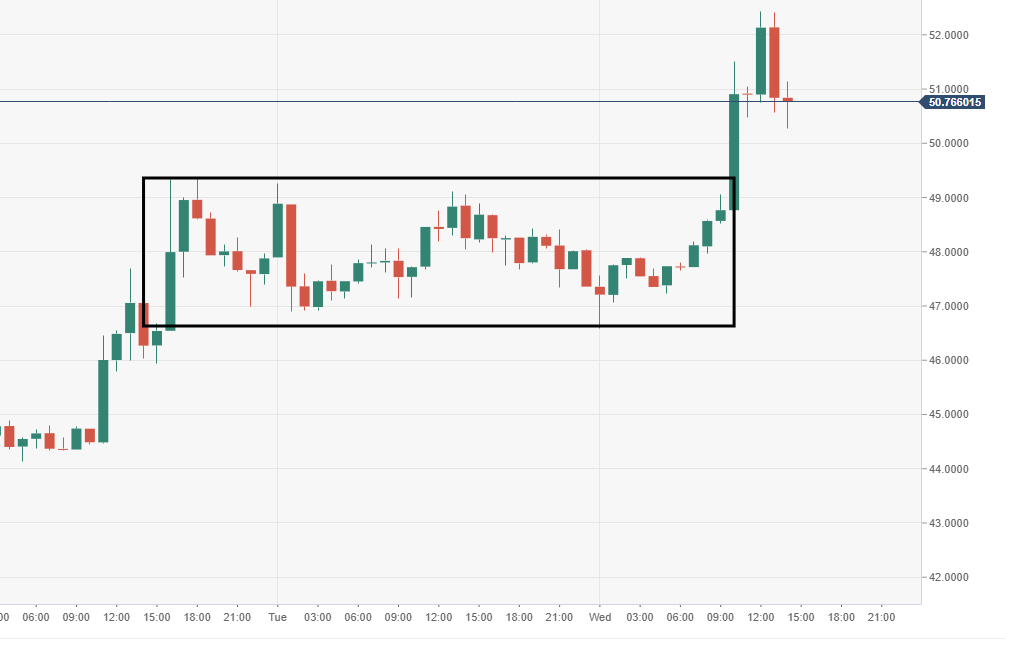
LTC/USD 60-minute chart

  • LTC/USD bulls force a range-break via the 60-minute chart view. 
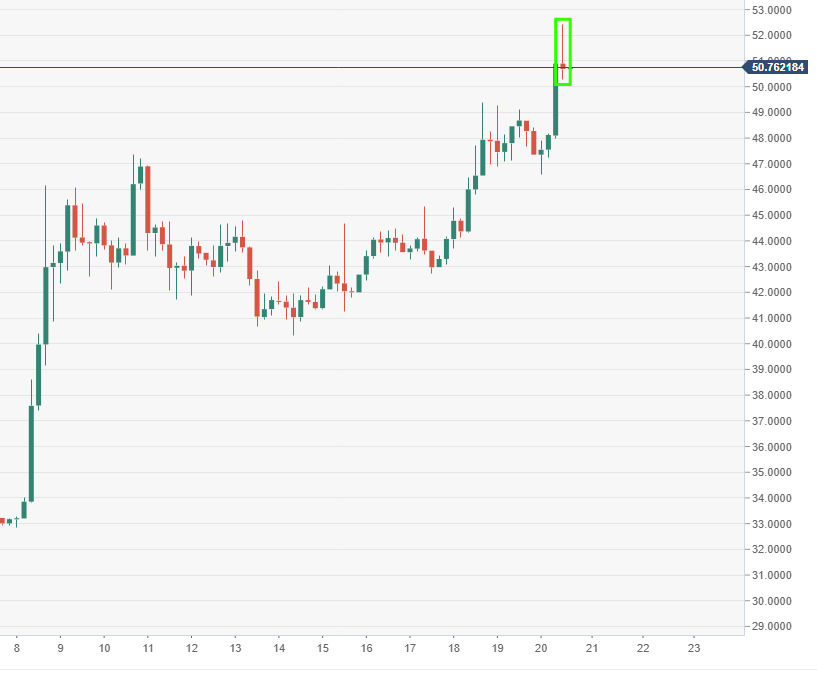
LTC/USD daily chart

  • Price action takes a chunky extension to the north following a flag breakout on the daily. 

Author

Ken Chigbo

Ken Chigbo

Independent Analyst

Ken has over 8 years exposure to the financial markets. He started his career as an analyst, covering a variety of asset classes; forex, fixed income, commodities and equities.

More from Ken Chigbo
Share:

Editor's Picks

XRP sell-off deepens amid weak retail interest, risk-off sentiment

Ripple (XRP) is edging lower around $1.36 at the time of writing on Wednesday, weighed down by low retail interest and macroeconomic uncertainty, which is accelerating risk-off sentiment.

Crypto Today: Bitcoin, Ethereum, XRP extend sell-off amid negative funding rates 

Bitcoin is down 15% in February and looks poised to extend its losses toward the yearly low of $60,000. Ethereum and Ripple are following in Bitcoin's footsteps, weighed down by a weak derivatives market. 

Hyperliquid tests key support as sell-side pressure intensifies

Hyerliquid (HYPE) drops to its 50-day Exponential Moving Average (EMA) at $28.85 at the time of writing on Wednesday, extending a decline of roughly 10% so far this week. 

Stellar Price Forecast: XLM risks revisiting $0.136 as sell-off continues

Stellar is trading below $0.160 at the time of writing on Wednesday, extending its correction for the fifth consecutive day. The bearish price action is further supported by rising short bets and declining Open Interest in the derivatives market. 

Bitcoin Price Annual Forecast: BTC holds long-term bullish structure heading into 2026

Bitcoin (BTC) is wrapping up 2025 as one of its most eventful years, defined by unprecedented institutional participation, major regulatory developments, and extreme price volatility.

Bitcoin: The worst may be behind us

Bitcoin (BTC) price recovers slightly, trading at $65,000 at the time of writing on Friday, after reaching a low of $60,000 during the early Asian trading session. The Crypto King remained under pressure so far this week, posting three consecutive weeks of losses exceeding 30%.