Litecoin: Recent uptick in RSI suggests a bullish breakout on the horizon
- Litecoin price respects a pennant formation with lower highs and higher lows.
- LTC price has seen RSI dipping towards 50, but bulls are picking up the volume with a recent uptick.
- A bullish breakout looks to be in the making, with a test at $236.96.

Litcoin (LTC) price has been putting in lower highs and higher lows since October 18 and is still respecting the trend lines that form the outline of a pennant pattern. During this time, the Relative Strength Index (RSI) briefly touched the overbought barrier but faded towards 50. A recent uptick spells more buy-side action and could see a pennant breakout towards $236.96.
Litcoin price RSI uptick signals increase in buy-volume
Litecoin price bounced off a green ascending trend line on Wednesday, and since then, the RSI has seen an uptick above 50. Bulls will probably have used the 55-day Simple Moving Average (SMA) and the monthly pivot at $177.40 as additional entry points for longs. Currently, the 200-day SMA saw a test but no break, and as LTC price holds above the 200-day SMA, a squeeze against the red descending trend line of the pennant could be a sign of a bullish breakout.
LTC price will want to see a clear break of the descending trend line at $215.34. Such a break would attract many hesitant buyers waiting on the sidelines. That signal would add a massive amount of new buying volume and easily break the R1 towards $236.96.
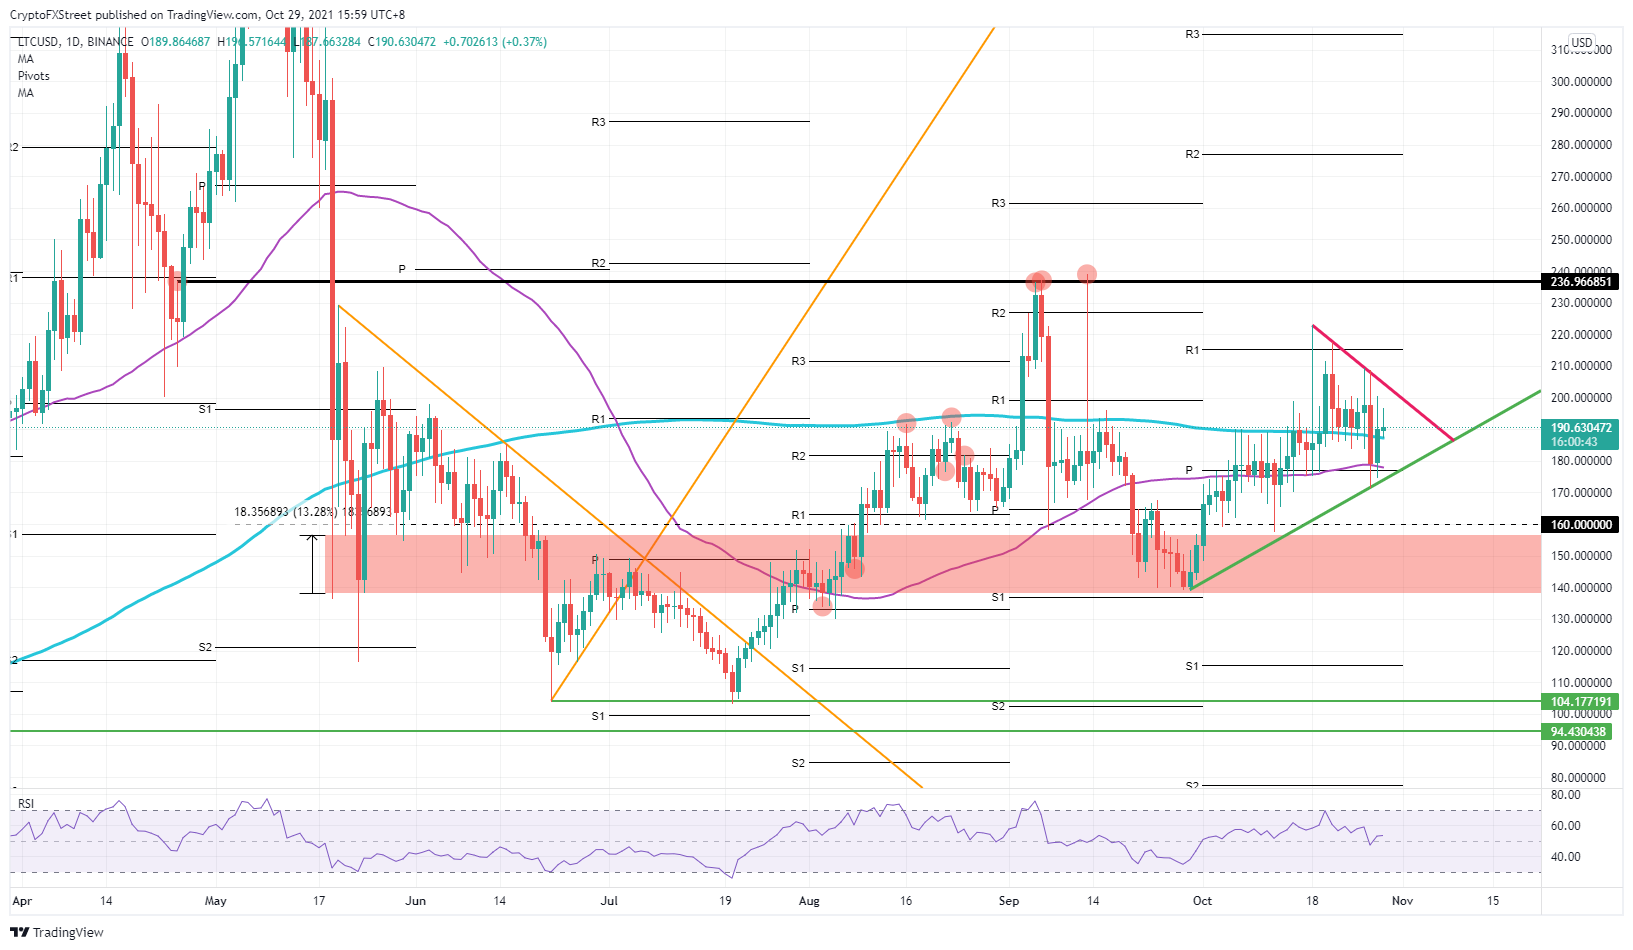
LTC/USD daily chart
With global markets a bit on the back foot today it could well be too soon for bulls to try and make a breakout. LTC price could get rejected by the red descending trend line which would push bears down back towards the monthly pivot at $177.40. A test and break of the green ascending trend line would see a return to the starting point of this uptrend at $140.
Author

Filip Lagaart
FXStreet
Filip Lagaart is a former sales/trader with over 15 years of financial markets expertise under its belt.


