Litecoin Price Analysis: LTC is ready for a downside correction after 30% growth
- Litecoin has gained over 30% on a week-to-week basis and become the best-performing digital asset out of the top-10.
- The technical indicators signal that the coin may be ready for a short-term downside correction.

LTC/USD hit the highest level since February 2020 at $83.91 during early Asian hours and retreated to $81 by the time of writing. Despite the downside correction, LTC has gained over 10% on a day-to-day basis and nearly 32% in the last seven days.
LTC bottomed at $41.6 on September 27 and has been growing steadily ever since amid the global recovery on the cryptocurrency market. It is the 6th largest digital asset with a current market capitalization of $5.3 billion and an average daily trading volume of nearly $7 billion.
The downside correction is around the corner
While currently, LTC is an apparent growth leader of the week out of top-10 coins, the situation is about to change any minute.
TD sequential indicator has already printed eight green candlestick on 4-hour and daily charts, meaning that the upside momentum is fading away and the price is ready to reverse.
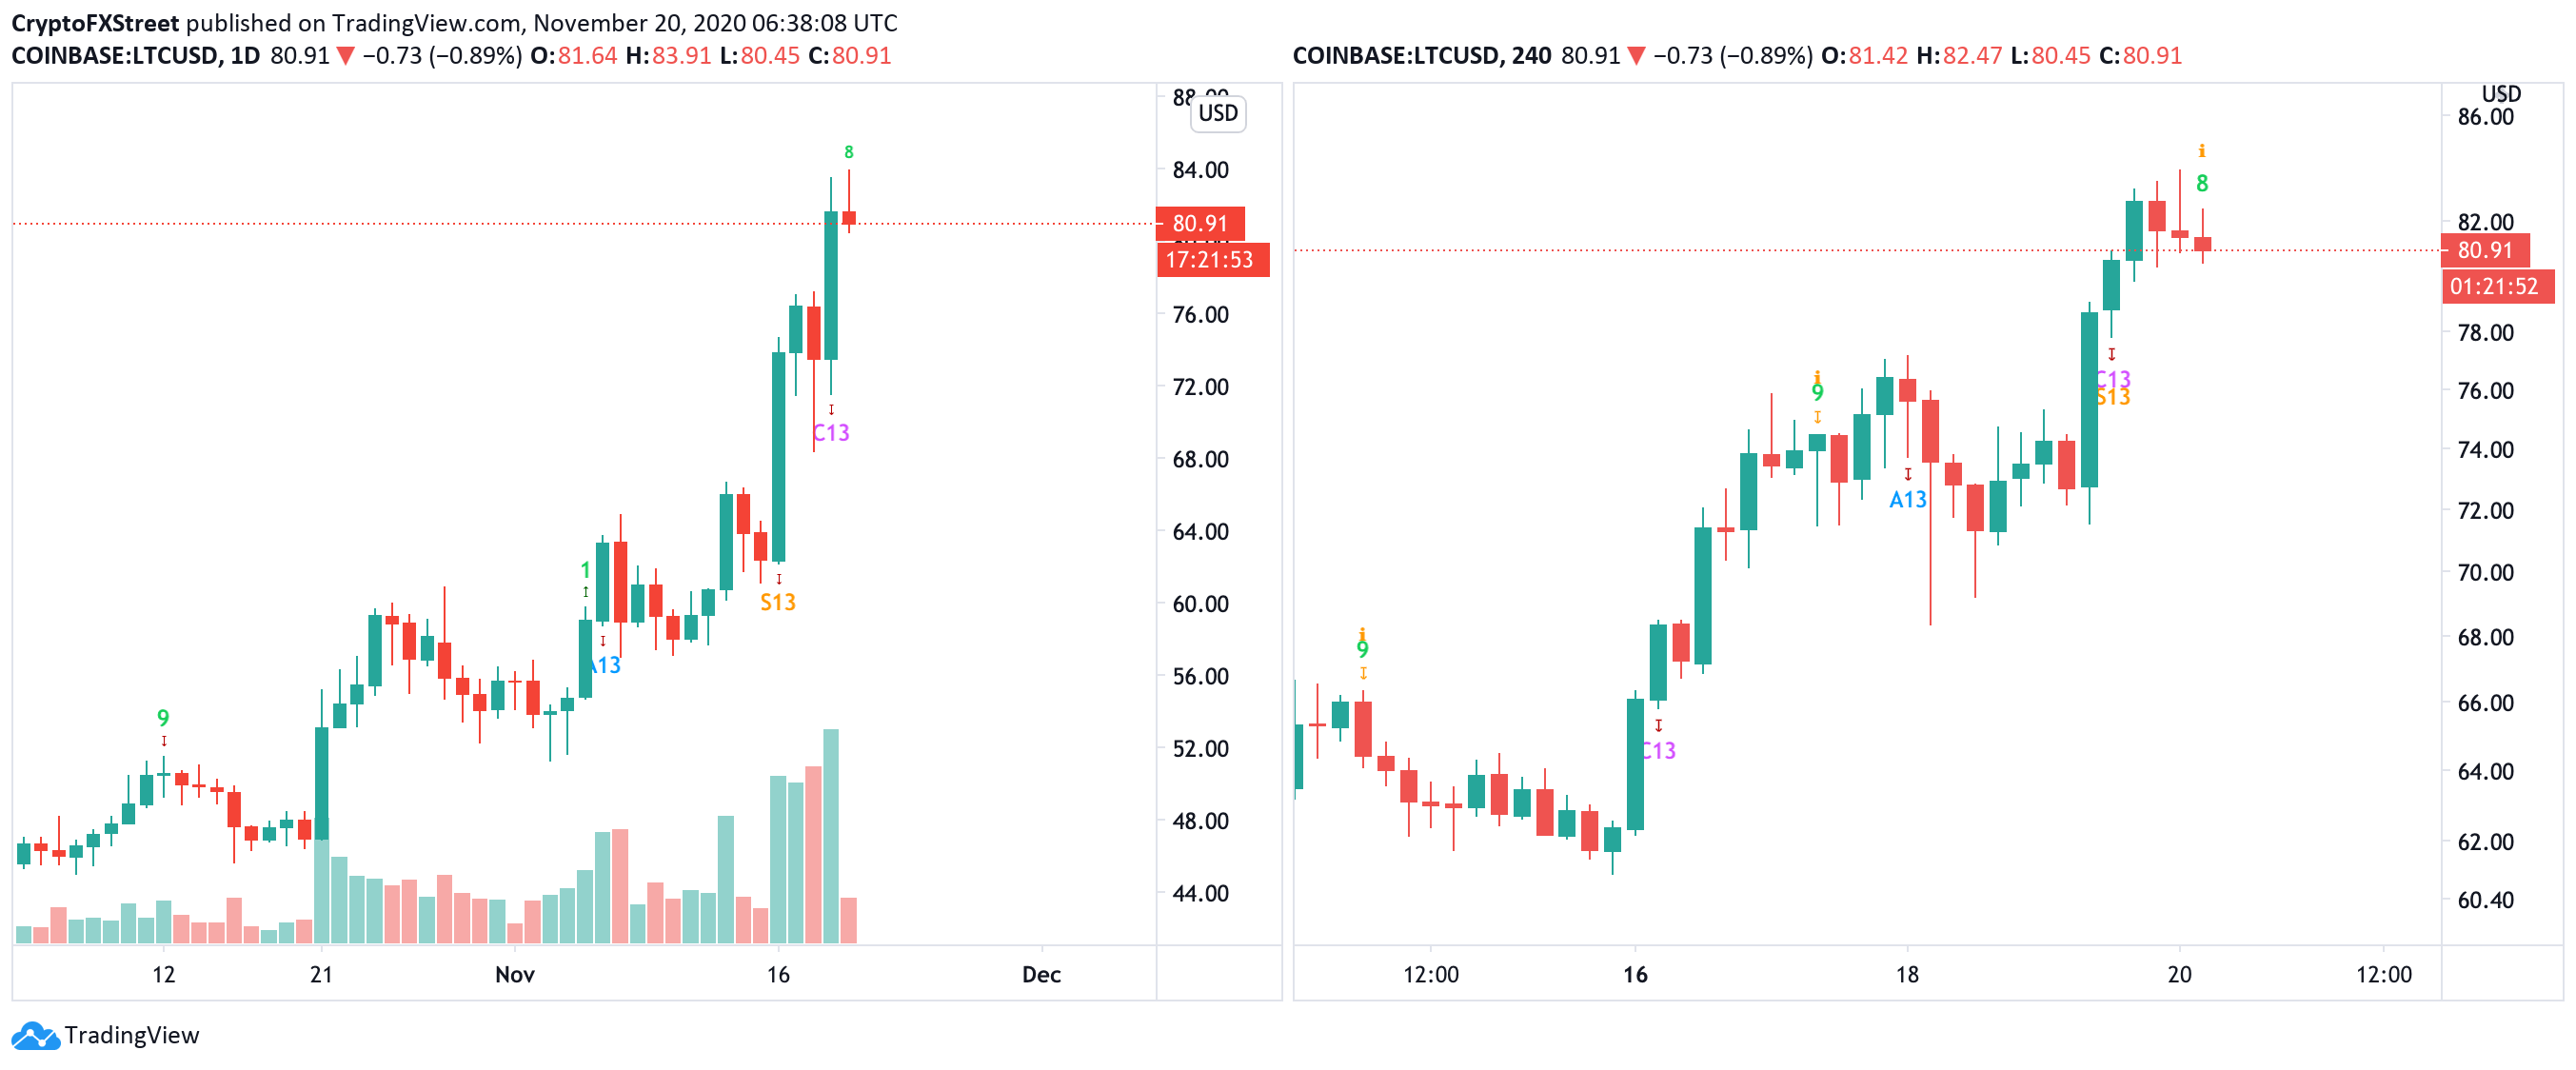
Litecoin, 4-hour and daily chart
Sure enough, the bearish scenario requires confirmation as the sell signal on a daily chart will come within the next 24 hours. It means that Litecoin has the potential to extend the upside a d retest a new 2020 high before the correction starts. However, the traders should be extra careful at this stage.
Litecoin's price forecast
Meanwhile, IntoTheBlock's "In/Out of the Money Around Price" model shows that LTC/USD faces a minor resistance on approach to $84 as over 22,000 addresses had previously bought 365,000 LTC between the current price and $83.5.
 Analytics and Charts20-637414522952328909.png)
LTC In/Out of the Money Around Price
This supply wall may slow down the bulls and create a pre-condition for a correction with the first target at $80, where 18,000 addresses had purchased nearly 700,000 million LTC. This support can absorb the bearish pressure, preventing Litecoin from falling further. If this area gives way, the sellers will bum into another significant barrier on approach to $75.
All in all, the IOMAP picture implies that LTC bears will have a hard time pushing the price down due to a thick layer of support barriers located all the way down to $68.
Meanwhile, on the upside, a sustainable move above $84 will allow for an extended recovery towards $86 and $90.
Author

Tanya Abrosimova
Independent Analyst



