Litecoin price analysis: Breakouts and breakdowns confuse the trend
- Breaks down and then breaks out.
- Finds resistance and then falls back towards support.

LItecoin has a typical situation wherein it has broken out, broken down again, only to break out again, finds resistance in the immediate charts and then falls back down to the very trendline it has been playing a break-up, patch-up game with.
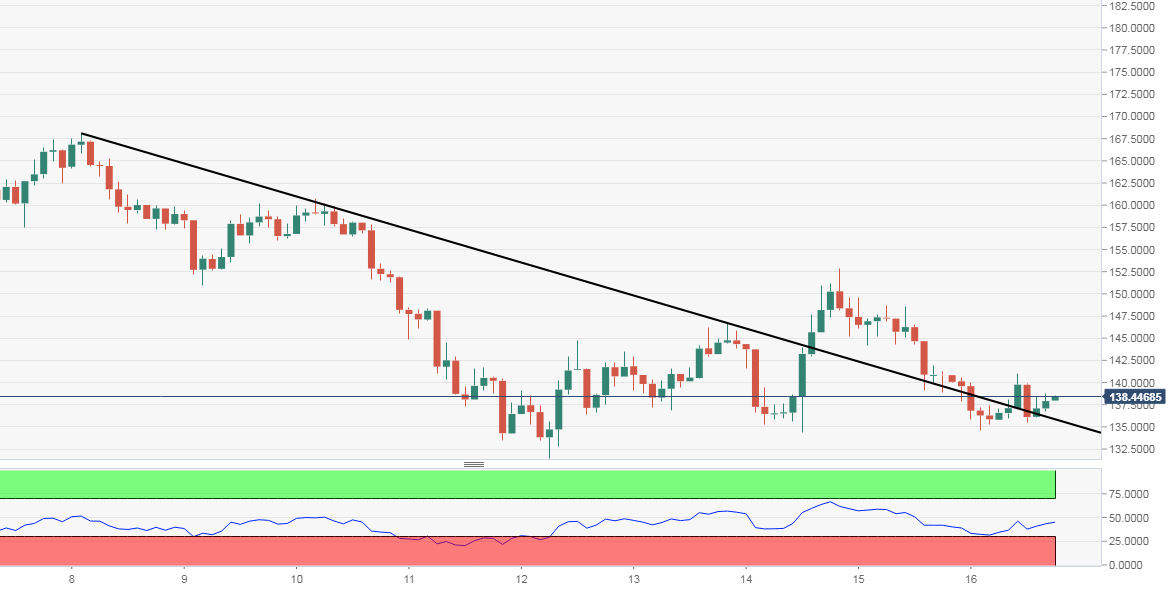
LTC/USD down less than a percent at $138.39 and trading in a narrow range of $134 and $141 through the day. On the 120-minute chart, the descending trendline has been kind of line in a sand that the price has been flirting with in the last two days. LTC, for now is firmly above this trendline and has another trendline resistance to cross.
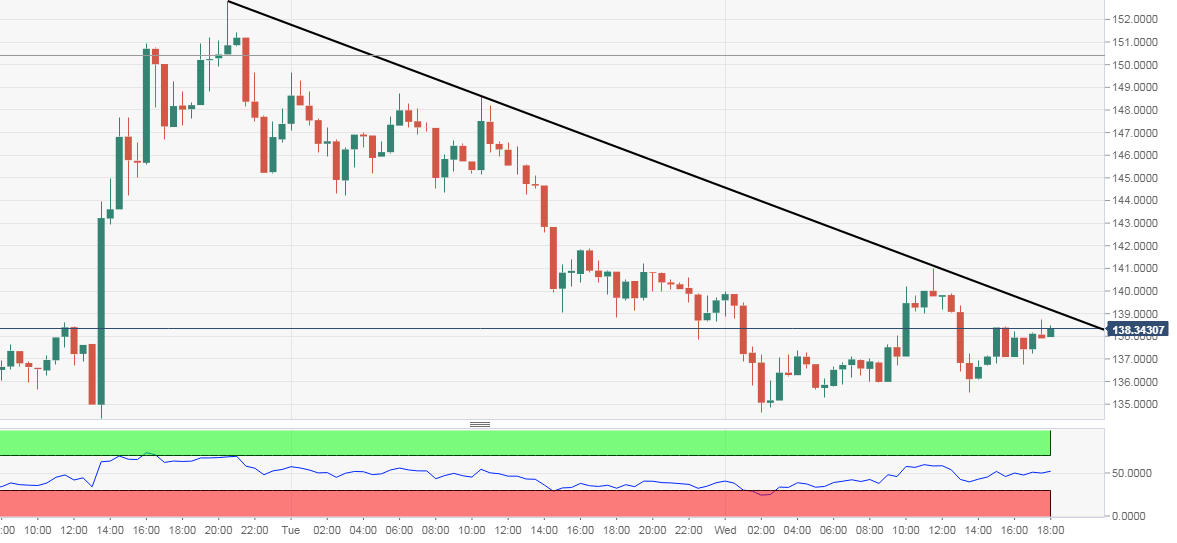
On the 30-minute chart, there's a small resistance for Litecoin to cross past, only then the earlier breakout would bear any fruits for the bulls.
LTC/USD 120-minute chart:
LTC/USD 30-minute chart:
Author

Manoj B Rawal
Independent Analyst
Manoj B Rawal, financial markets professional with about 11 years of experience in writing, editing and advising on stocks, currencies and fixed income.


