|

Litecoin develops bullish buying pattern before LTC hits $150

  • Litecoin price action develops a pattern seen across the altcoin space: the inverse head-and-shoulders pattern.
  • LTC faces a strong cluster of resistance before it can move towards the $200 value area.
  • Downside risks are significant and highly probable.

Litecoin price faced significant selling pressure on Thursday, following other risk-on markets lower due to war jitters and continued inflation worries. However, that didn’t stop LTC from developing a likely bullish reversal setup.

Litecoin price must cross and close above $143 to prevent further bearish pressure

Litecoin price has a massive collection of resistance levels ahead that it must break before extending into a bull market. Between the price levels of $130 to $143, Litecoin must break the following technical levels:

  1. Daily Tenkan-Sen at $130
  2. 38.2% Fibonacci retracement at $132
  3. Top of the Ichimoku Cloud (Senkou Span B) at $133
  4. The neckline of the inverse head-and-shoulders pattern at $140
  5. 50% Fibonacci retracement at $143

The number of resistance levels and the strength of those levels may prove to be a daunting task – but certainly not insurmountable. The most critical, near-term level for bulls to target is a close above the Ichimoku Cloud at or above $133. In that scenario, most of the short-term bearish outlook would be eliminated.
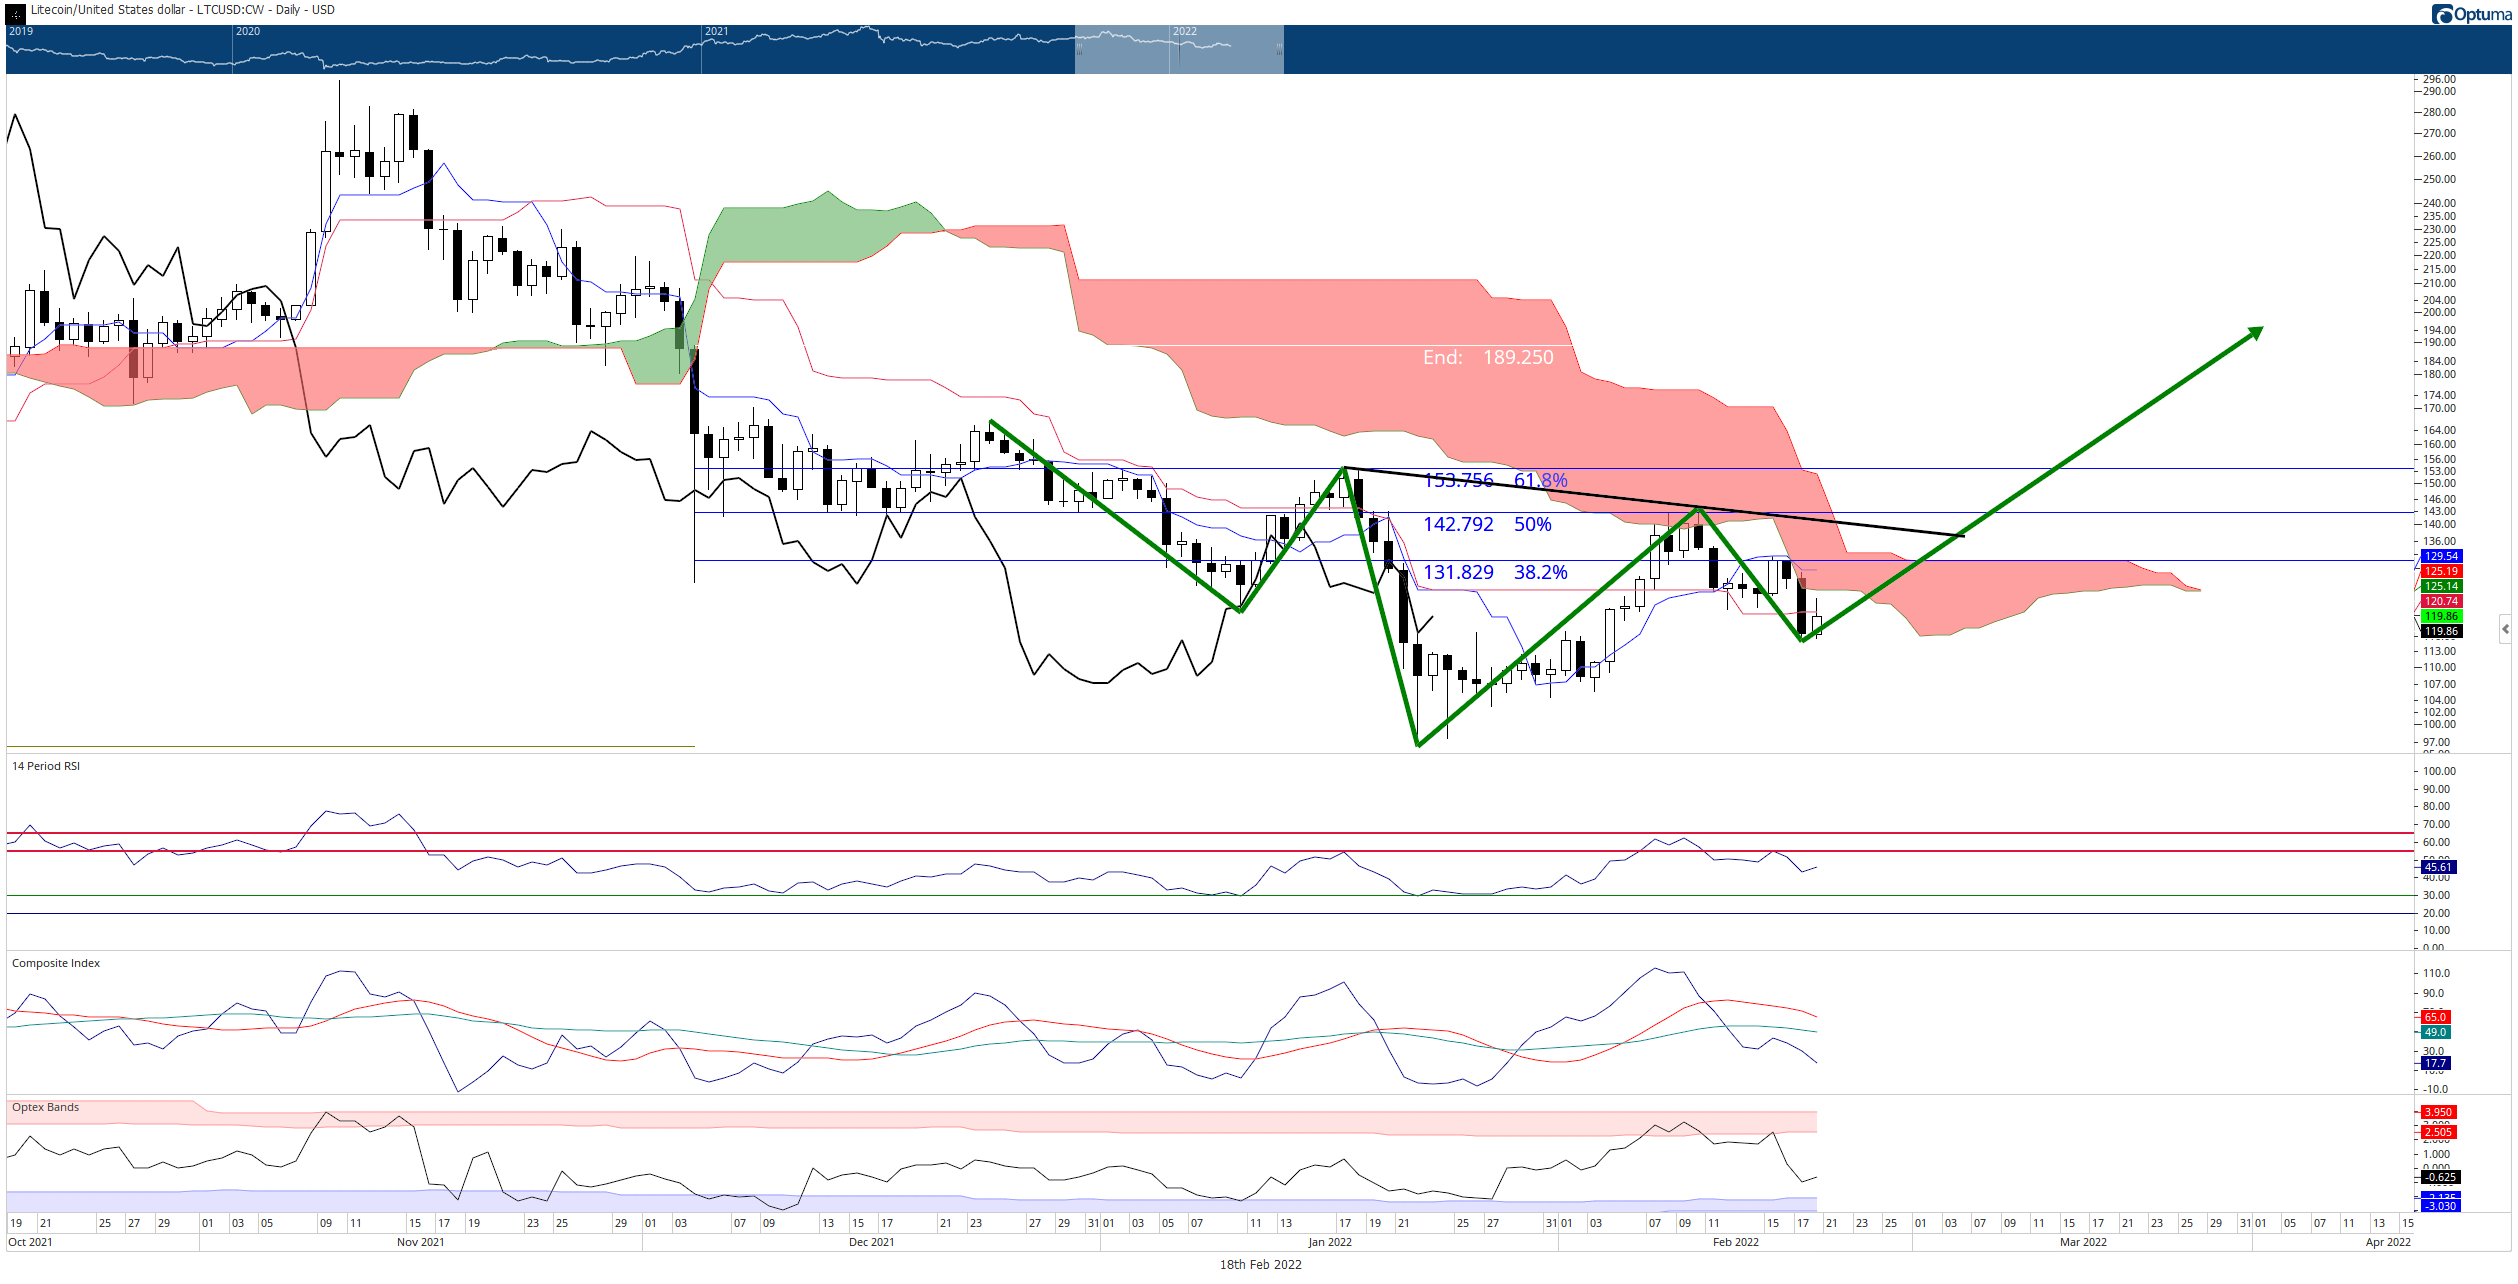
LTC/USD Daily Ichimoku Kinko Hyo Chart

However, bears are not far away from achieving a move that could trigger a considerable sell-off below the $100 level. If the Chikou Span closes at or below $106, it will be below the bodies of the candlesticks and in open space – initiating an Ideal Bearish Ichimoku Breakout. From there, a push towards $95 for Litecoin price is highly probable.

Author

Jonathan Morgan

Jonathan Morgan

Independent Analyst

Jonathan has been working as an Independent future, forex, and cryptocurrency trader and analyst for 8 years. He also has been writing for the past 5 years.


More from Jonathan Morgan
Share:

Editor's Picks

Zcash Price Forecast: ZEC declines as US inflation surprise offsets fresh ETF inflows

Zcash is trading in the red, extending its previous day’s roughly 6% losses as the broader cryptocurrency market falls on rising US inflation. The US Consumer Price Index print came in higher than expected, at an annual increase of 3.7% versus the expected 3.6%, raising concerns about inflation and rate hikes.

Ripple and Stellar outlook: XRP and XLM extend losses as US inflation data weighs in

Ripple and Stellar extend their losses on Thursday as bearish momentum builds, having corrected over 7% and 11% so far this week. XRP and XLM both slip below key support zones, indicating weakening technical structure.

Bitcoin falls on hot CPI: Why $80,000 support matters

Bitcoin's most critical level to watch is near $80,000 as September's hot inflation reading pressures the crypto market, according to Glassnode. The top crypto declined within minutes of the September CPI release, which showed a 3.7% annual increase in headline inflation, above forecasts of 3.6%. Core inflation, which excludes food and energy prices, came in at 2.6%.

Ethereum Price Forecast: ETH falls below $2,500 as hot CPI raises Fed hike odds
Ethereum (ETH) extended its decline below $2,500 on Wednesday after a hotter-than-expected US inflation print renewed selling across the crypto market. At the time of writing, the top altcoin trades near $2,430, down 3.1% in the past 24 hours. The US Consumer Price Index (CPI) for September rose 0.6% monthly, in line with market forecasts and up from a 0.4% increase in August.
Bitcoin: Uptober or Rektober?
Bitcoin (BTC) price is down over 4% so far this week, trading below $83,000 at the time of writing on Friday as mounting selling pressure threatens to derail the seasonal “Uptober” rally. Profit-taking, a surge in long liquidations and weakening demand from institutional investors are weighing on BTC.


