IOTA Price Analysis: IOT/USD battles triangle resistance for a potential breakout to $0.26
- IOTA has the potential to break the triangle resistance at $0.2170.
- Technical signals have remained relatively positive despite the resistance at $0.2170.

IOTA has commenced the trading on Thursday on a bullish note. The symphony of the bullish tune is reverberating well with the buyers. Following the slide to lows around $00.1877, attempts have been made to push the price higher. Unfortunately, the resistance at $0.22 has proved to be an uphill task.
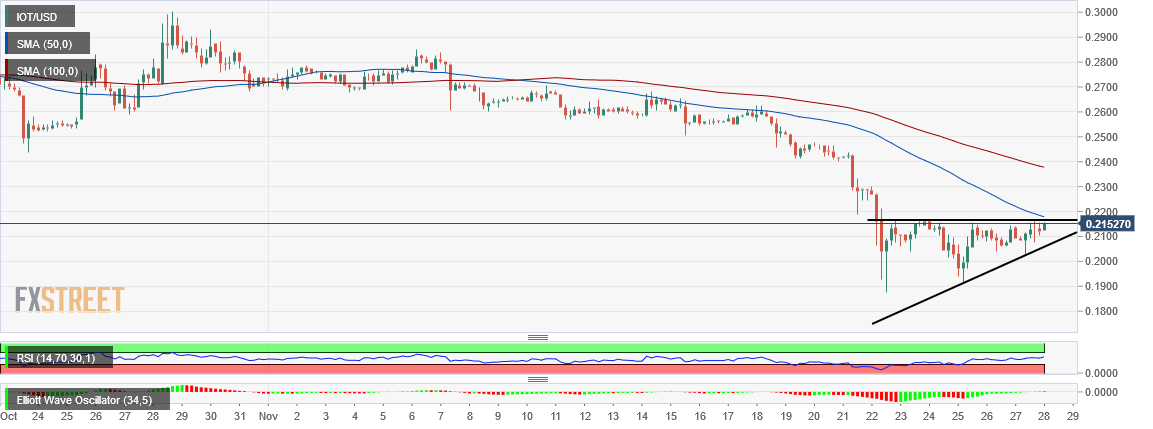
The price is, however, nurturing a bullish an upward trend above a short term ascending trendline. The trend also meets a horizontal resistance line at $0.2170 to form a rising triangle pattern. If the triangle resistance is cleared, chances are the bulls will be rejuvenated and increase entries, pushing the price towards the supply zone at $0.26.
On the other hand, IOTA could fall back under $0.20 in the event the triangle support is broken. The upside is initially limited by the 50 SMA on the 4-hour chart at $0.2182. Other resistance zones include $0.23, the 100 SMA at $0.2378 and the major supply zone at $0.30.
The technical picture is relatively positive especially with the RSI grinding towards 70. The Elliott Wave Oscillator is posting a bullish session for the second day in a row.
IOT/USD 4-hour chart

Author

John Isige
FXStreet
John Isige is a seasoned cryptocurrency journalist and markets analyst committed to delivering high-quality, actionable insights tailored to traders, investors, and crypto enthusiasts. He enjoys deep dives into emerging Web3 tren


