IOTA: False breakout?
- IOTA prices broke out of a key trendline, only to breakdown again.
- Little more downtick could be chaotic for the bulls.

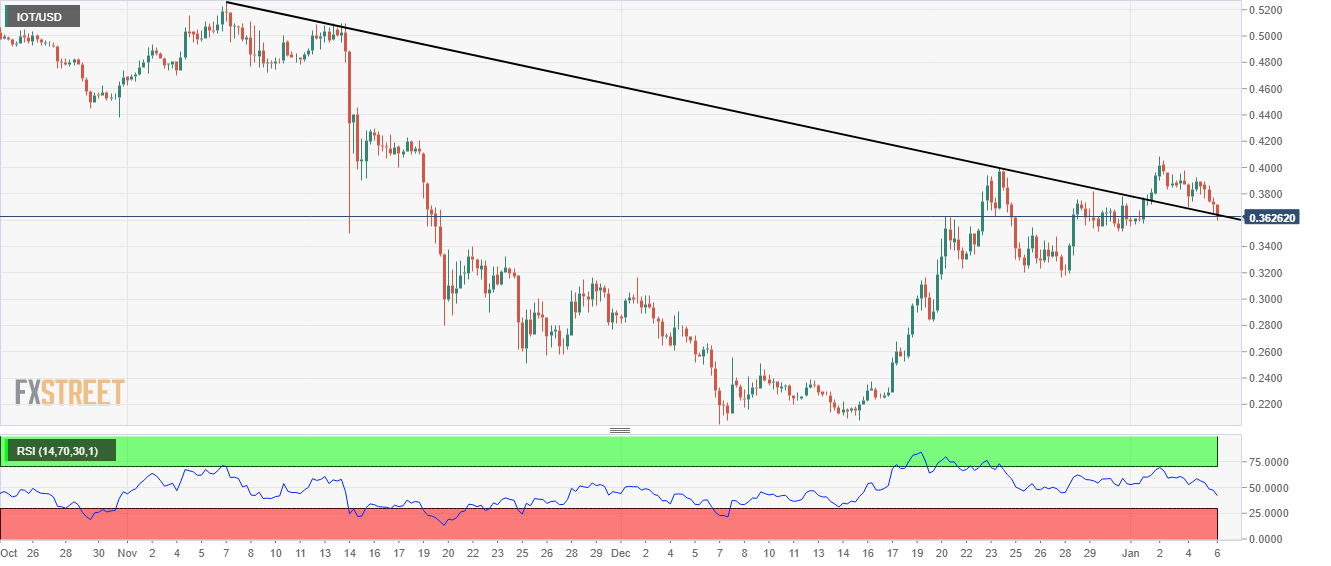
IOTA prices broke out of a key trendline resistance on the medium term chart, earlier this week, only to break down again of the very trendline, in a sign that it was a false breakout and any more downtick from here could be catastrophic for the prices.
IOT/USD is down more than 3 percent on day at $0.363, just around low point of the day. On the six-hour chart of the crypto, IOTA broke out of a key trendline resistance on Wednesday, signalling the new year may have brought new dawn for the bulls, but that was not to be.
Bears were able to grab failure in price momentum, taking it just below the same trendline that the bulls earlier broke on the upside. Even a 2 percent downtick from here would mean it can turn catastrophic for the bulls.
IOT/USD 360-minute chart:
Get 24/7 Crypto updates in our social media channels: Give us a follow at @FXSCrypto and our FXStreet Crypto Trading Telegram channel
Author

Manoj B Rawal
Independent Analyst
Manoj B Rawal, financial markets professional with about 11 years of experience in writing, editing and advising on stocks, currencies and fixed income.


