IOT/USD Technical Analysis: IOTA sees a low momentum bullish trend
- IOT/USD looks to break $0.263 resistance in the short term.
- The bears are still rallying back since the breakouts lack momentum, however, the bulls are standing their ground as of now.

IOT/USD daily chart
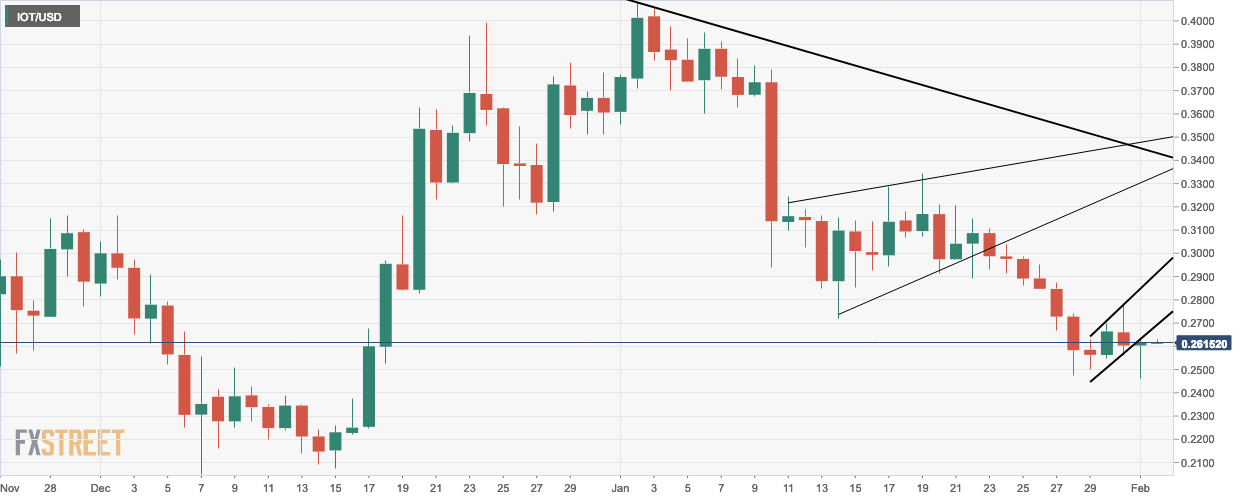
- The market has a slightly bullish breakout after the bearish flag formation.
IOT/USD hourly chart
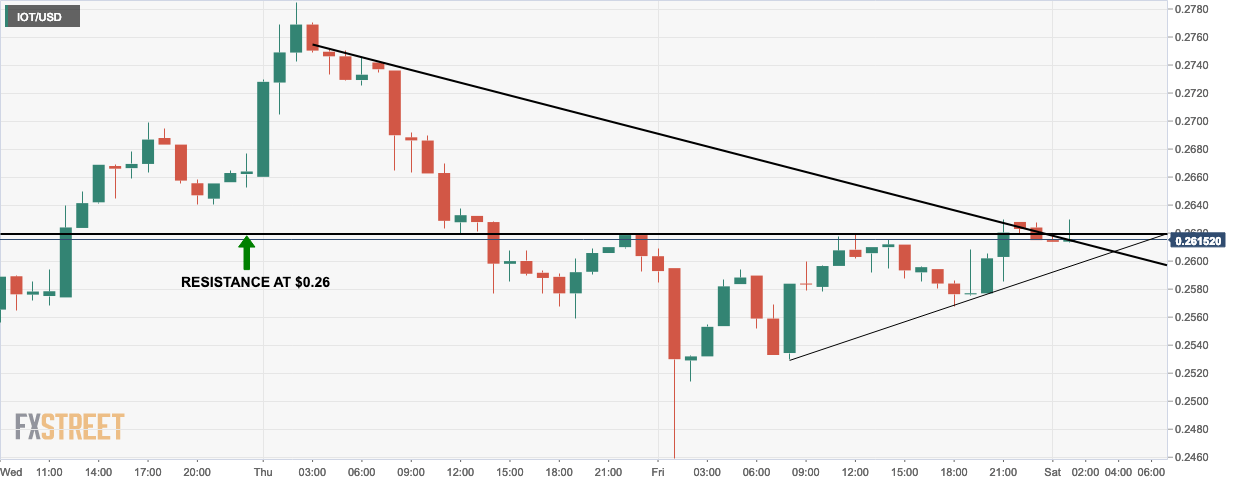
- The IOT/USD hourly chart forms a triangle which leads to a bullish breakout.
- Resistance at $0.26 has been breached.
IOT/USD 4-hour chart
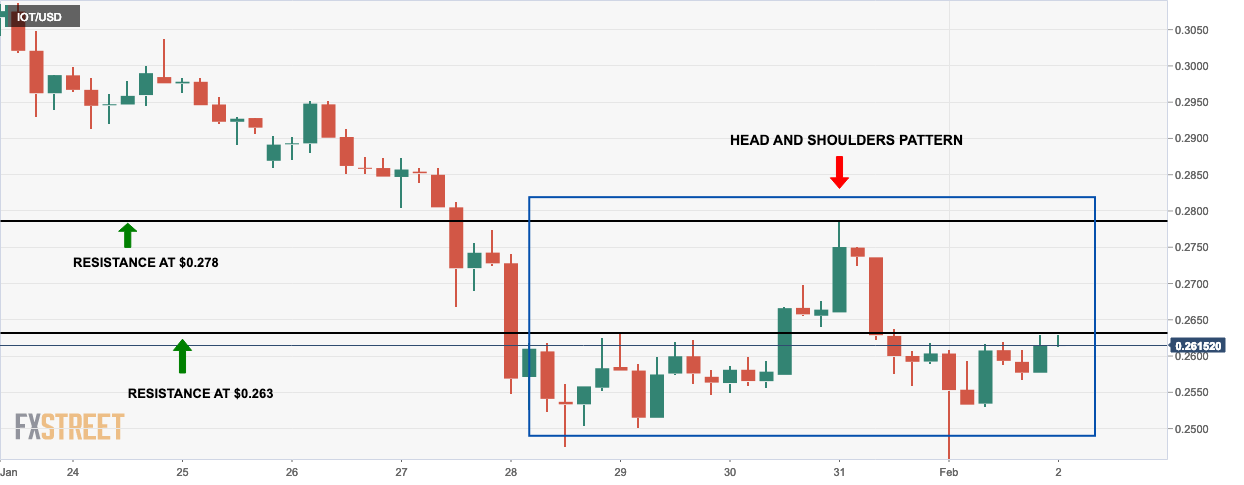
- IOT/USD 4-chart forms the head and shoulders pattern.
- The market is testing the $0.263 resistance level.
Key Levels
- Resistance 3: $0.28474
- Resistance 2: $0.27387
- Resistance 1: $0.26768
- Pivot Point: $0.25682
- Support 1: $0.25063
- Support 2: $0.23976
- Support 3: $0.23358
Author

FXStreet Team
FXStreet
More from FXStreet Team


