How to identify Solana price bullish reversal signs
- Solana price may encounter increased volatility this weekend after flaunting numerous buy signals.
- The recent multimillion-dollar hack on Solana’s digital wallets appears to have had only a minor impact on SOL price.
- Solana price will likely stretch its bullish leg 11.92% to $44.42 following a falling wedge pattern breakout.

Solana price firmly held to slightly higher support to curb declines witnessed this week compared to July’s primary anchor at $35.00. The smart contracts token suffered a significant hack attack early Wednesday, eliciting a lot of negative sentiment and short selling. However, Solana price appears to have quickly come out of the spiral from $46.67 to its most recent buyer congestion at $38.00.
Solana price quickly moves on from Wednesday’s multimillion hack
On Wednesday, several investors endured agony and frustration when an unknown hacker made away with approximately $5 million in SOL, SPL and other Solana-based tokens from digital wallets like Phantom.
The hacker targeted digital wallets, drawing the crypto community’s attention to the security of tokens stored on such platforms. Some investors called short positions in SOL, intending to buy the token at lower prices later. Most likely, it is the same traders driving Solana price higher after it secured support at $35.00.
Santiment’s Social Volume metric below indicates increased mentions and discussions around SOL between August 1 and 4. Investors have become resilient, thus remaining relatively undisturbed by such events. In the past, hacks and exploits have always resulted in double-digit losses. Nevertheless, the hack does not sit well with the smart contracts platform, which hopes to topple the gigantic Ethereum.
 [14.29.19, 05 Aug, 2022]-637952971431745627.png)
Solana Social Volume
As the community marches on from the hack, Solana price presents key bullish signals. For instance, the Moving Average Convergence Divergence (MACD) on the four-hour chart beckoned buyers to double down their efforts as the 12-day Exponential Moving Average (EMA) crossed above the 26-day EMA.
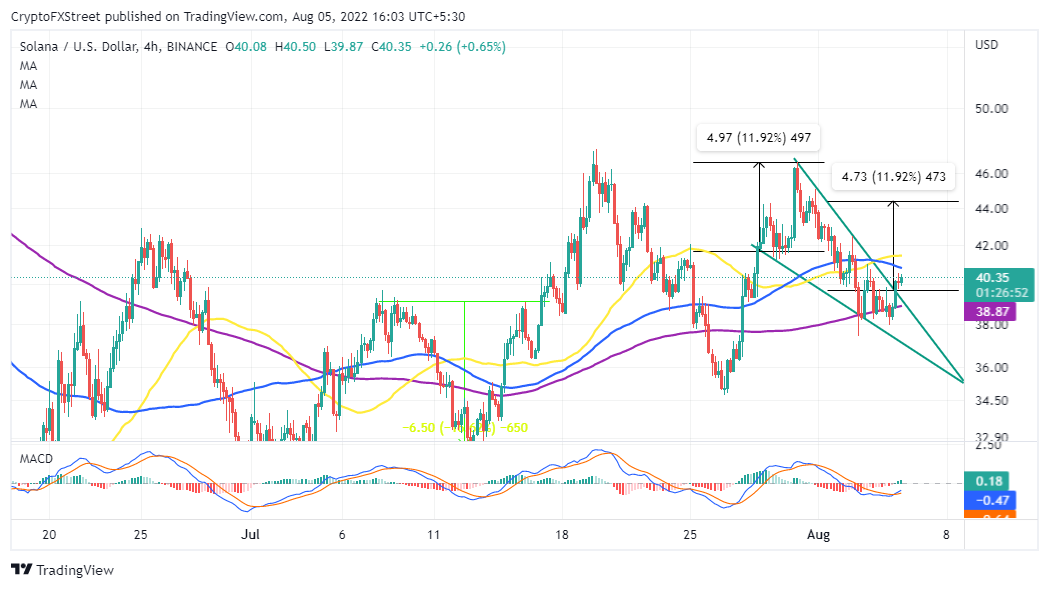
SOL/USD four-hour chart
Traders will also appreciate an 11.92% climb from a falling wedge pattern, as observed on the four-hour chart. This pattern forms after a significant upside move in price followed by a bearish correction. A period of consolidation crowns the pattern ahead of a bullish breakout, equal to the distance between the widest points of the wedge.
It is worth mentioning that a recovery to $44.42 is not guaranteed, hence the need for traders to consider booking profits at $42.00. Some of the hurdles Solana price will have to deal with as it ascends 11.92% north, are the 100-day Simple Moving Average (SMA) and the 50-day SMA, which may delay or sabotage the expected bullish outcome.
Author

John Isige
FXStreet
John Isige is a seasoned cryptocurrency journalist and markets analyst committed to delivering high-quality, actionable insights tailored to traders, investors, and crypto enthusiasts. He enjoys deep dives into emerging Web3 tren


