Fantom price is poised for a 15% rally after breaking above a falling wedge pattern
- Fantom price encounters the upper trendline of a falling wedge pattern breakout, signals a bullish move.
- On-chain data shows that FTM's TVL and Open Interest are rising, suggesting growing activity and interest within the FTM ecosystem.
- A daily candlestick close below $0.320 would invalidate the bullish thesis.

Fantom (FTM) price encounters the upper trendline of a falling wedge pattern in the European trading session and trades lower below $0.380 on Friday. On-chain data shows that FTM's Total Value Locked (TVL) and Open Interest are rising, suggesting growing activity and interest within the FTM ecosystem, which indicates a bullish move on the horizon.
Fantom price action shows potential for a rally ahead
Fantom price retests the upper trendline of a falling wedge pattern on Friday. This pattern is drawn from joining multiple high and low levels with a trendline and a breakout of this pattern, signaling a bullish move. As of Friday, FTM trades down by around 3% below $0.380.
If FTM breaks above the falling pattern and closes above the daily resistance level at $0.414, it could rally 15% to retest its July 30 high of $0.477.
The Relative Strength Index (RSI) and the Awesome Oscillator (AO) are about to flip above their neutral levels of 50 and zero, respectively. If bulls are indeed making a comeback, then both momentum indicators must maintain their positions above their respective mean levels. Such a development would add a tailwind to the recovery rally.
If the bulls are aggressive and the overall crypto market outlook is positive, FTM could extend an additional 13% rally to retest its daily resistance at $0.542.
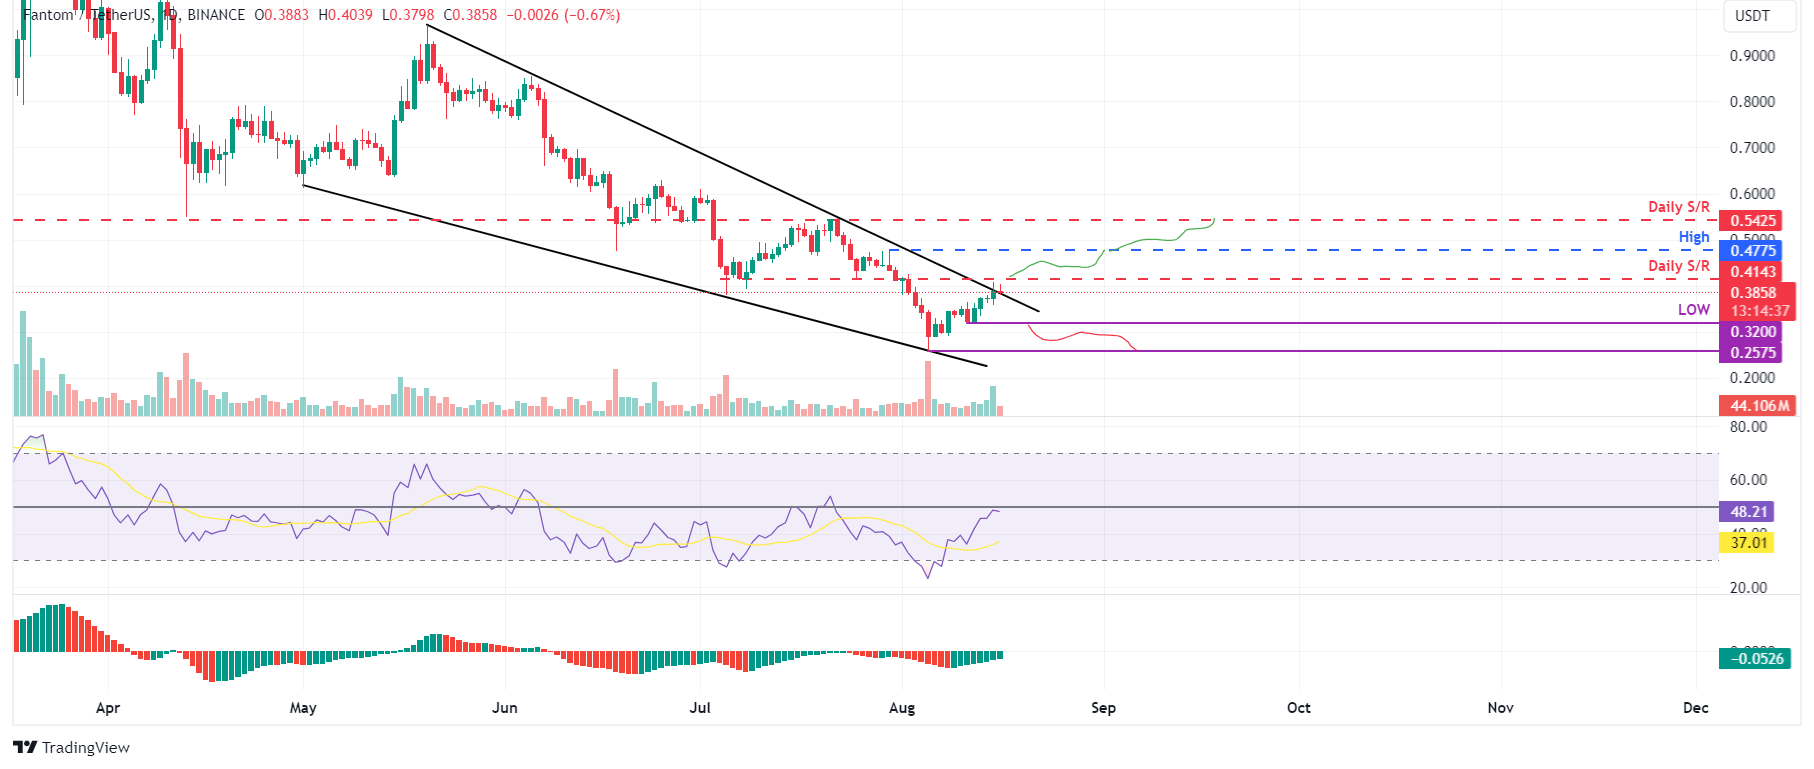
FTM/USDT daily chart
Data from CoinGlass shows that the futures' Open Interest (OI) in Fantom at exchanges is also increasing. The OI indicates the total number of outstanding derivative contracts that have not been settled (offset by delivery) and whether money flows into the contract are increasing or decreasing.
Increasing OI represents new or additional money entering the market and new buying, which suggests a bullish trend. When OI decreases, it is usually a sign that the market is liquidating, more investors are leaving, and the current price trend is ending.
The graph below shows that FTM's OI increased from $60.08 million on Monday to $114.78 million on Friday, indicating that new or additional money is entering the market and new buying is occurring.
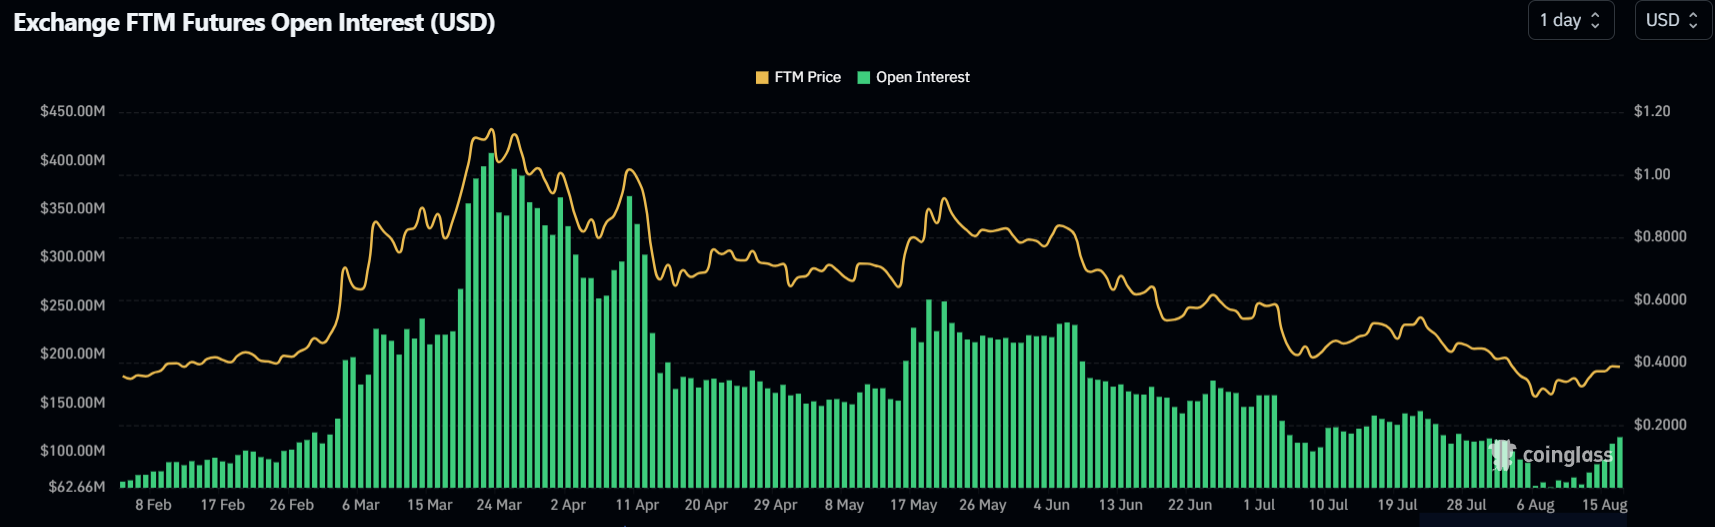
FTM Open Interest chart
Additionally, crypto intelligence tracker DefiLlama data shows that FTM's Total Value Locked (TVL) increased from $110.65 million on Tuesday to $131.43 million on Friday.
This 19% increase in TVL indicates growing activity and interest within the Fantom ecosystem. It suggests that more users are depositing or utilizing assets within FTM-based protocols, adding further credence to the bullish outlook.
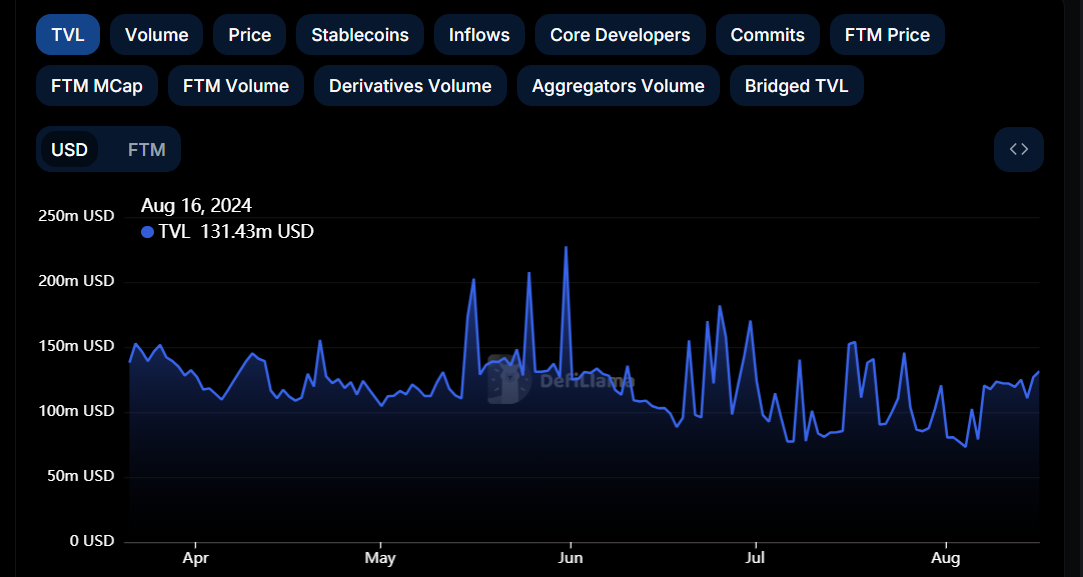
FTM TVL chart
Despite the bullish thesis signaled by both on-chain data and technical analysis, the outlook will shift to bearish if FTM's daily candlestick closes below the $0.320 daily low of August 11. This scenario could lead to a 19% crash to retest its August 5 low of $0.257.
Author

Manish Chhetri
FXStreet
Manish Chhetri is a crypto specialist with over four years of experience in the cryptocurrency industry.


