Ethereum technical analysis: Will ETH/USD re-enter the $240-zone for the first time in more than three weeks?
- ETH/USD fell from $233.55 to $228.25 in the early hours of Tuesday.
- Bears have taken control of the hourly ETH/USD market.

ETH/USD daily chart
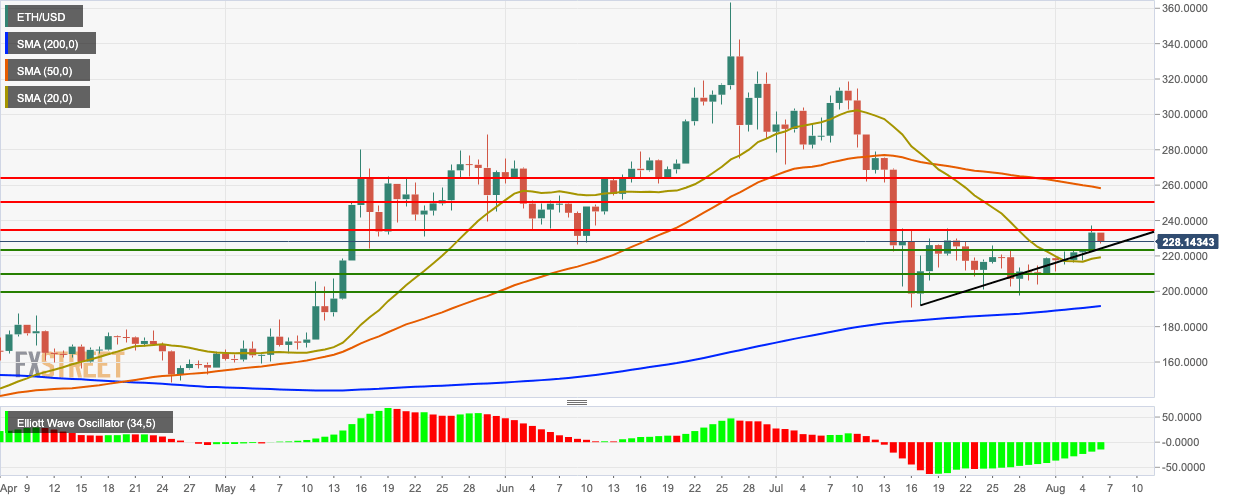
The daily ETH/USD chart has found support on the upward trending line. Initial resistance level lies at $234.50. The 20-day simple moving average (SMA 20) and SMA 200 curves are trending below the daily chart, while the SMA 50 is trending above. The Elliot oscillator shows 14-straight bullish sessions.
ETH/USD 4-hour chart
-637006564612433991.png)
The 4-hour ETH/USD was trending in the red Ichimoku cloud before trending upwards. The price went up to $233.85, where it met resistance, consolidated for a bit, and then dropped down to $228.25. The relative strength index (RSI) indicator was trending in the overbought zone before falling to 60.95.
ETH/USD hourly chart
-637006564906186208.png)
The market met resistance at $233.20 before dropping down to $228.25. The hourly price chart is flirting with the lower curve of the Bollinger band. The 20-day Bollinger jaw is narrowing, indicating lower market volatility. The moving average convergence/divergence (MACD) indicator shows increasing bearish momentum.
Key Levels
Author

Rajarshi Mitra
Independent Analyst
Rajarshi entered the blockchain space in 2016. He is a blockchain researcher who has worked for Blockgeeks and has done research work for several ICOs. He gets regularly invited to give talks on the blockchain technology and cryptocurrencies.


