Ethereum Technical Analysis: ETH/USD may have to drop back down to $80 to find committed buyers
- Ethereum price on Thursday nursing losses of just some 0.3% latter part of session.
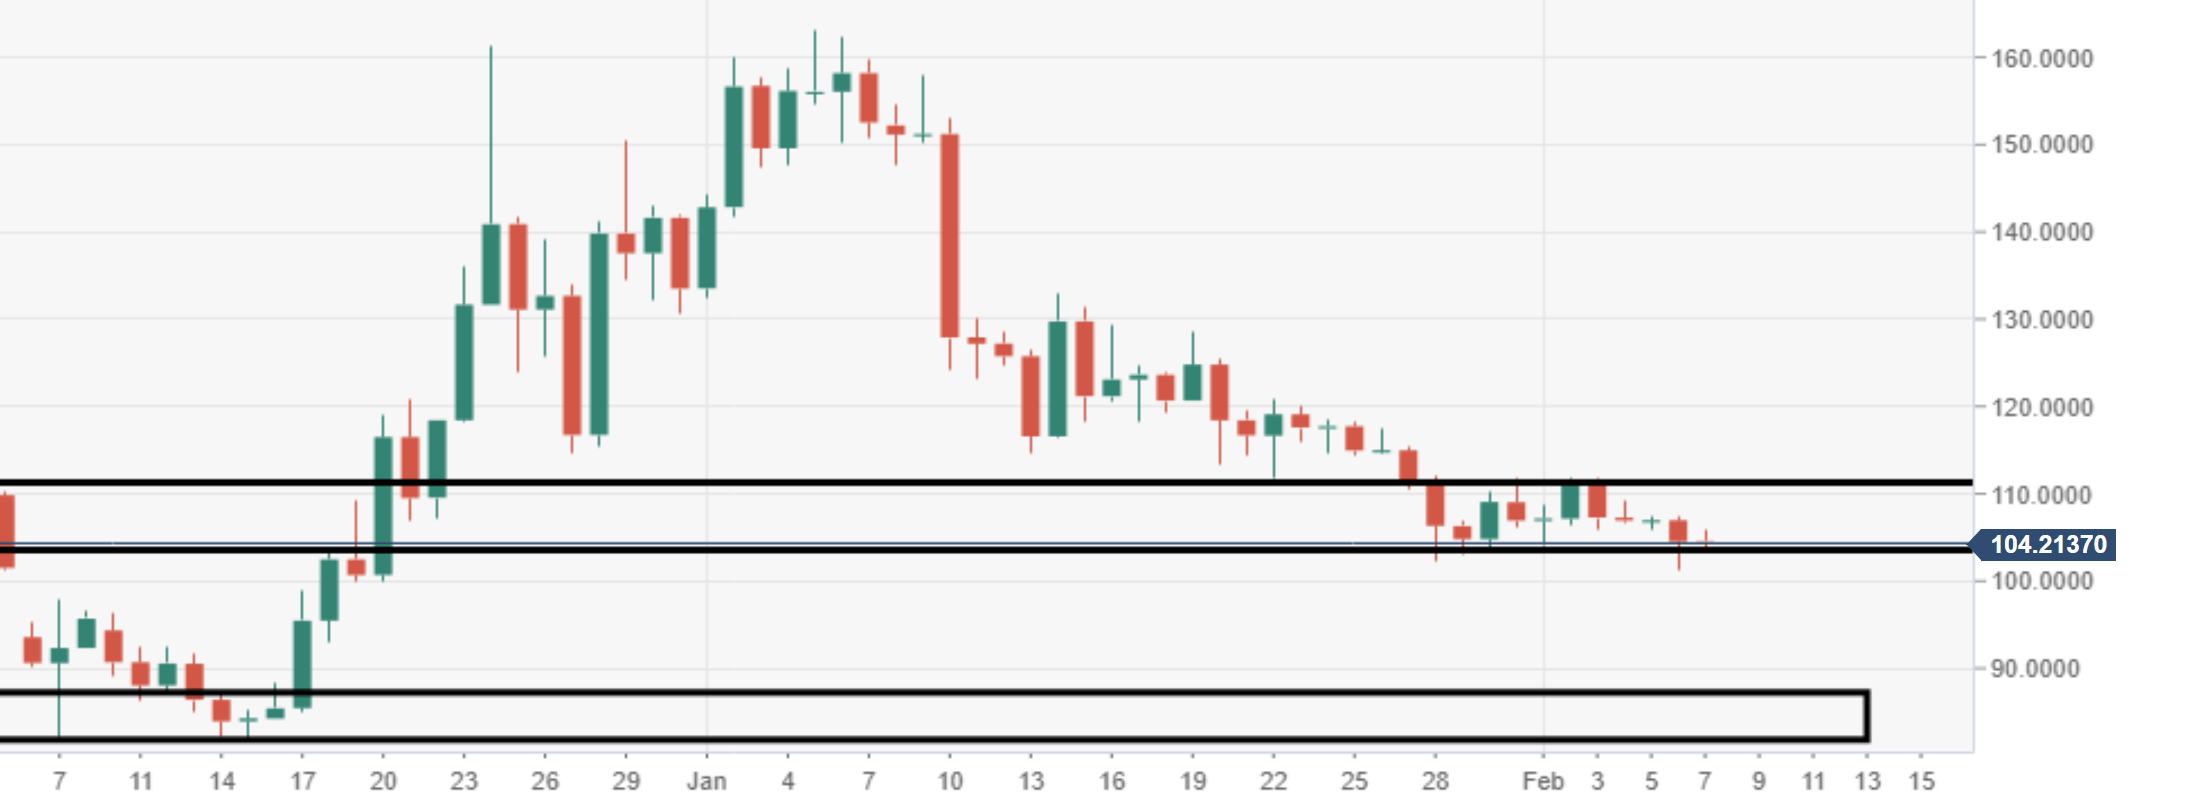
- ETH/USD sees a huge area of demand protecting the $100 area, but may be subject to a break lower soon enough. Bearish target eyed at December 2018 low area, within $80 territory.

ETH/USD 15-minute chart
- Price action breached a near-term ascending trend line, inviting a wave of selling this afternoon.
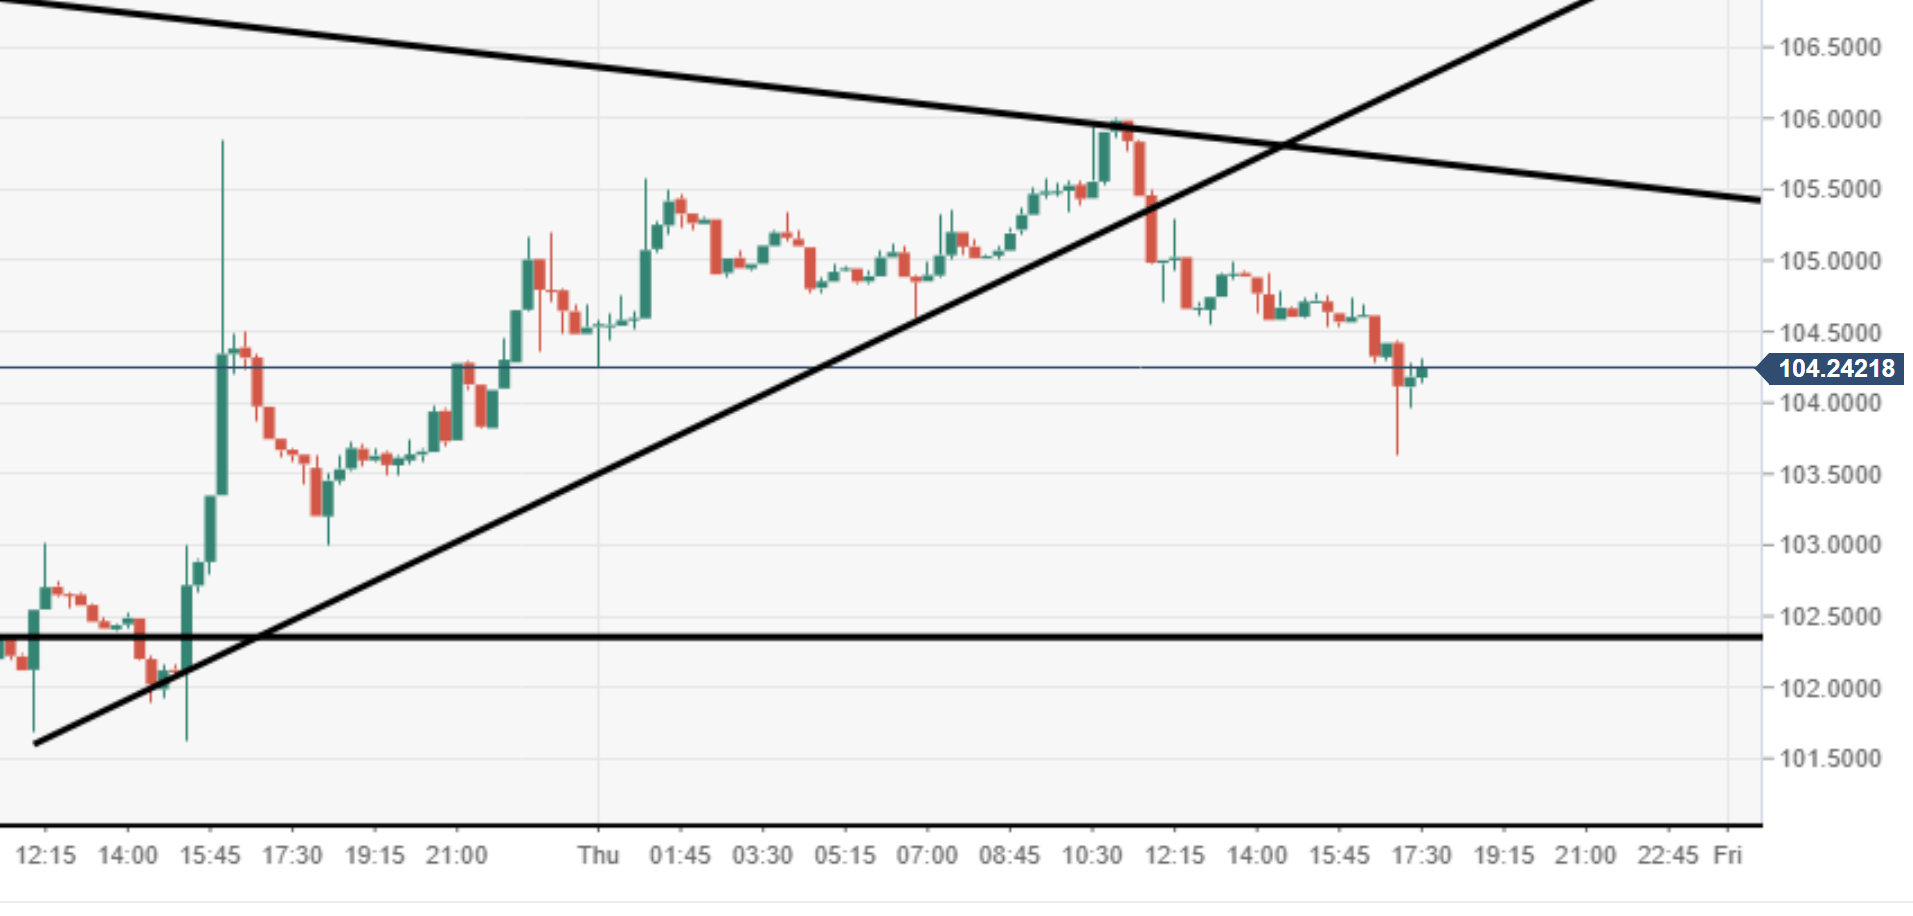
Spot rate: 104.26
Relative change: -0.30%
High: 106.00
Low: 103.63
Trend: Bearish/Neutral
Support 1: 101.34, daily pivot point support.
Support 2: 98.15, daily pivot point support.
Support 3: 95.17, daily pivot point support.
Resistance 1: 107.51, daily pivot point resistance.
Resistance 2: 110.49, daily pivot point resistance.
Resistance 3: 113.68, daily pivot point resistance.
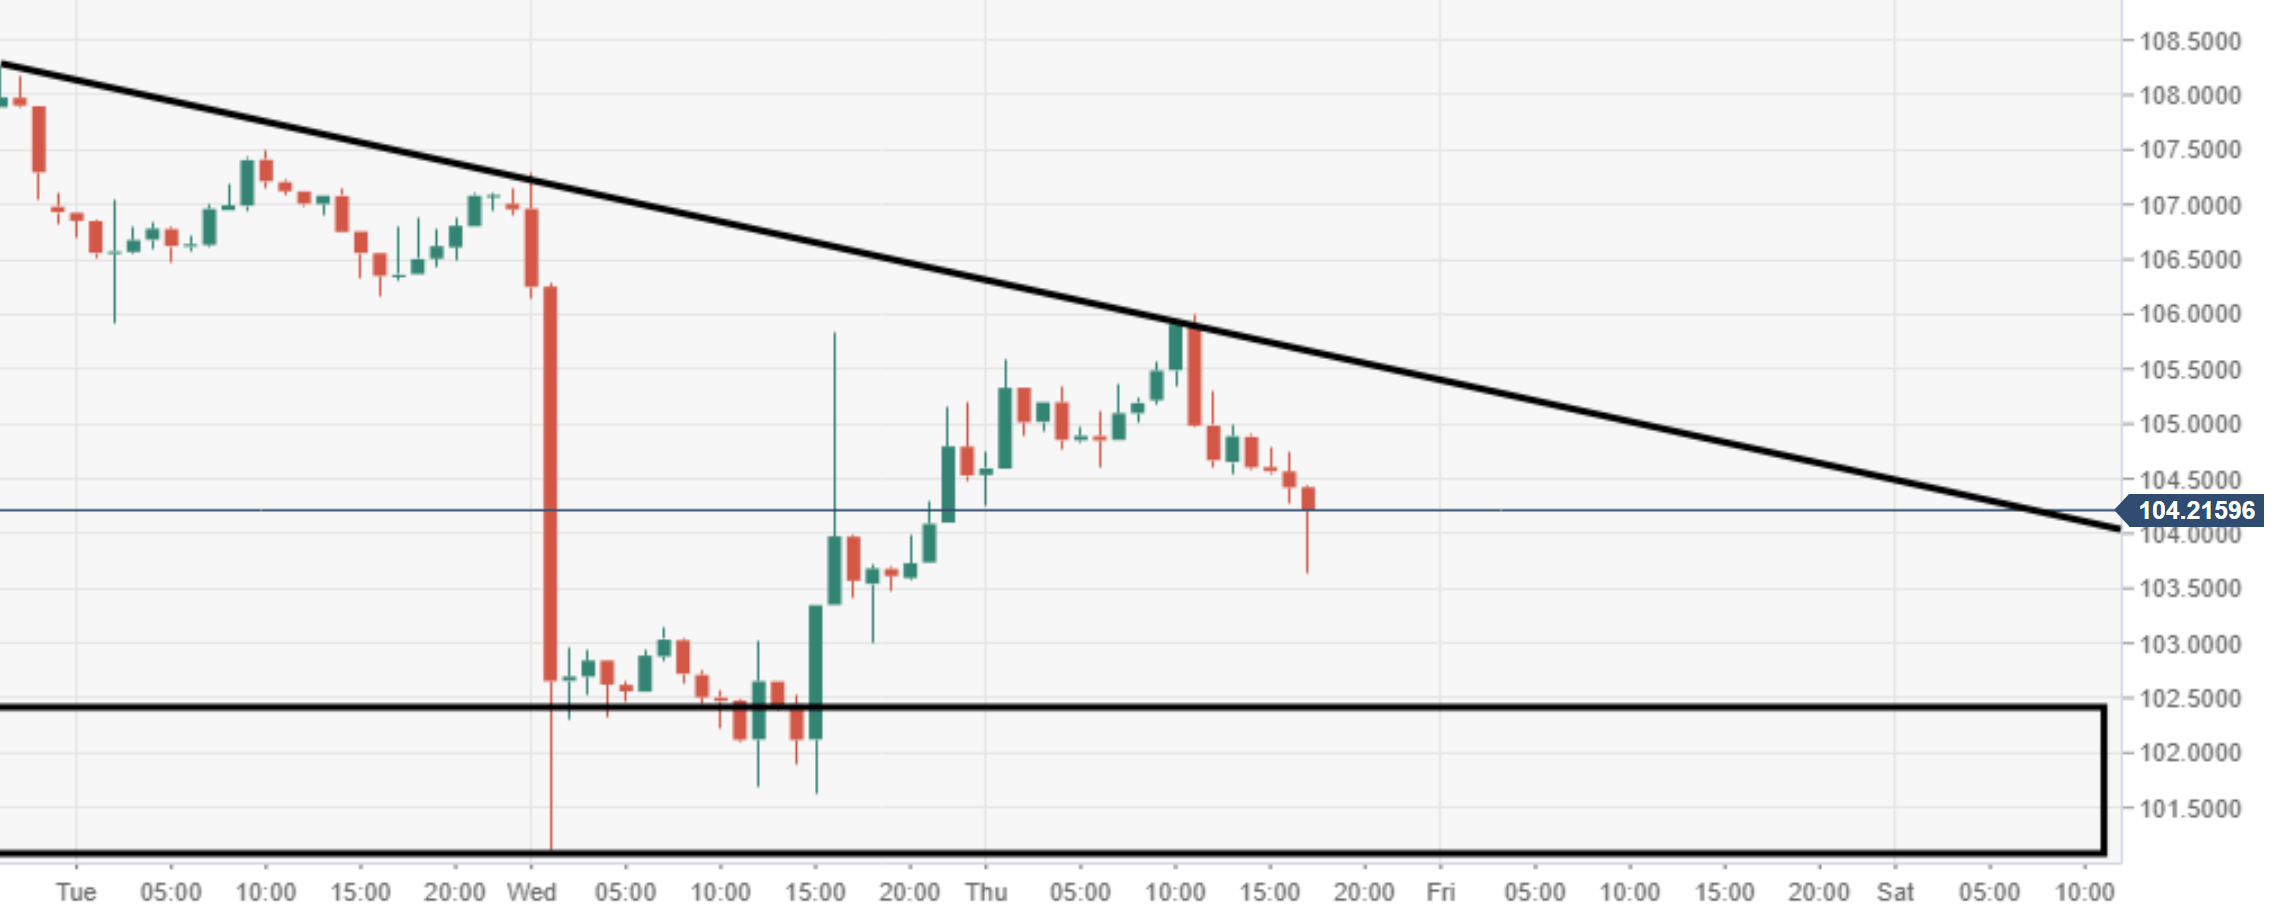
ETH/USD 60-minute chart
- Near-term bearish momentum could drive the price to retest the $100 handle. Further south, eyes will be on $80 territory, December 2018 low area.
ETH/USD daily chart
- Huge daily support eyed protecting the big psychological $100 mark, remains under threat.
Author

Ken Chigbo
Independent Analyst
Ken has over 8 years exposure to the financial markets. He started his career as an analyst, covering a variety of asset classes; forex, fixed income, commodities and equities.


