|

Ethereum technical analysis: ETH/USD extreme narrow conditions subject to a breakout

  • Ethereum price is trading marginally in the red, down 1.90% the session on Thursday.
  • ETH/USD trading within very narrow conditions, the daily range is $180-195.
  • The price continues to have difficulty trading to break down the resistance ahead of the big $200 mark.

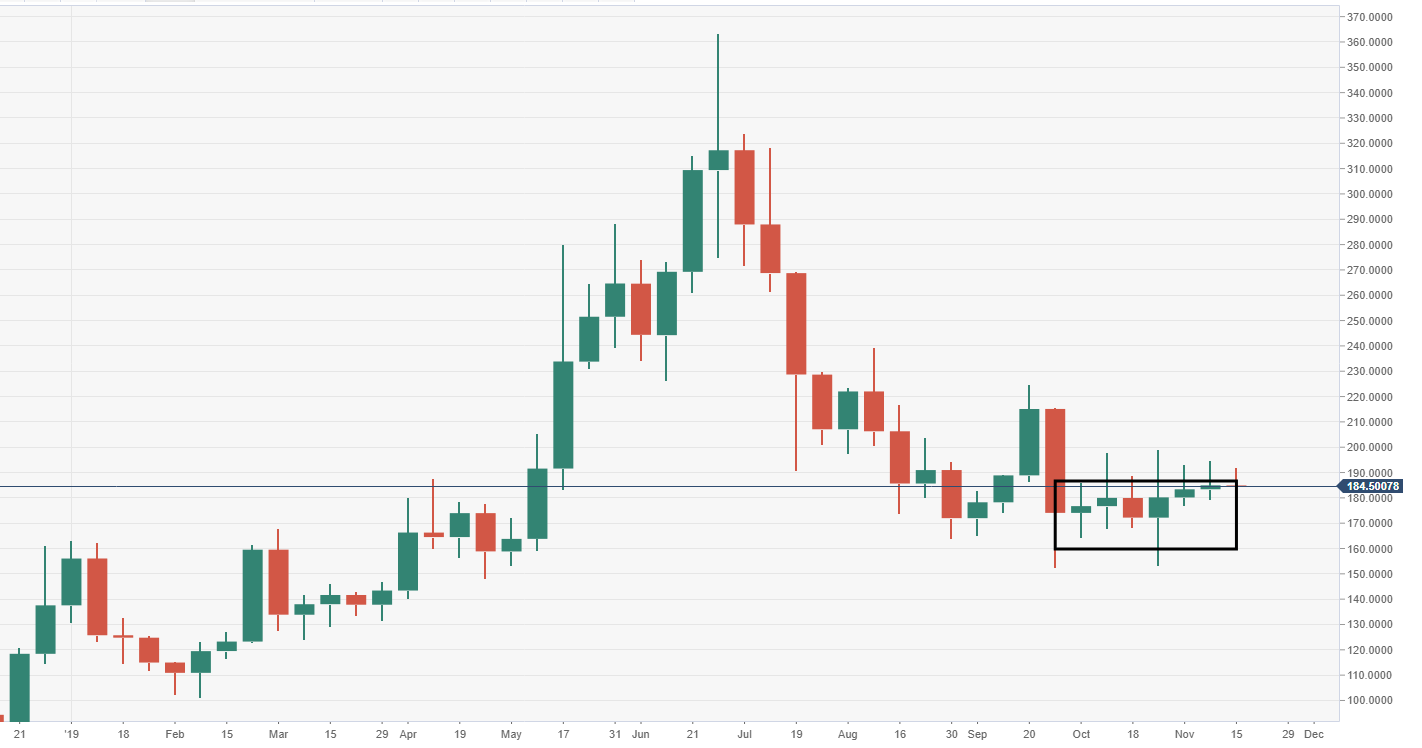
ETH/USD weekly chart

Price action has been narrowing greatly within the last seven weeks. 
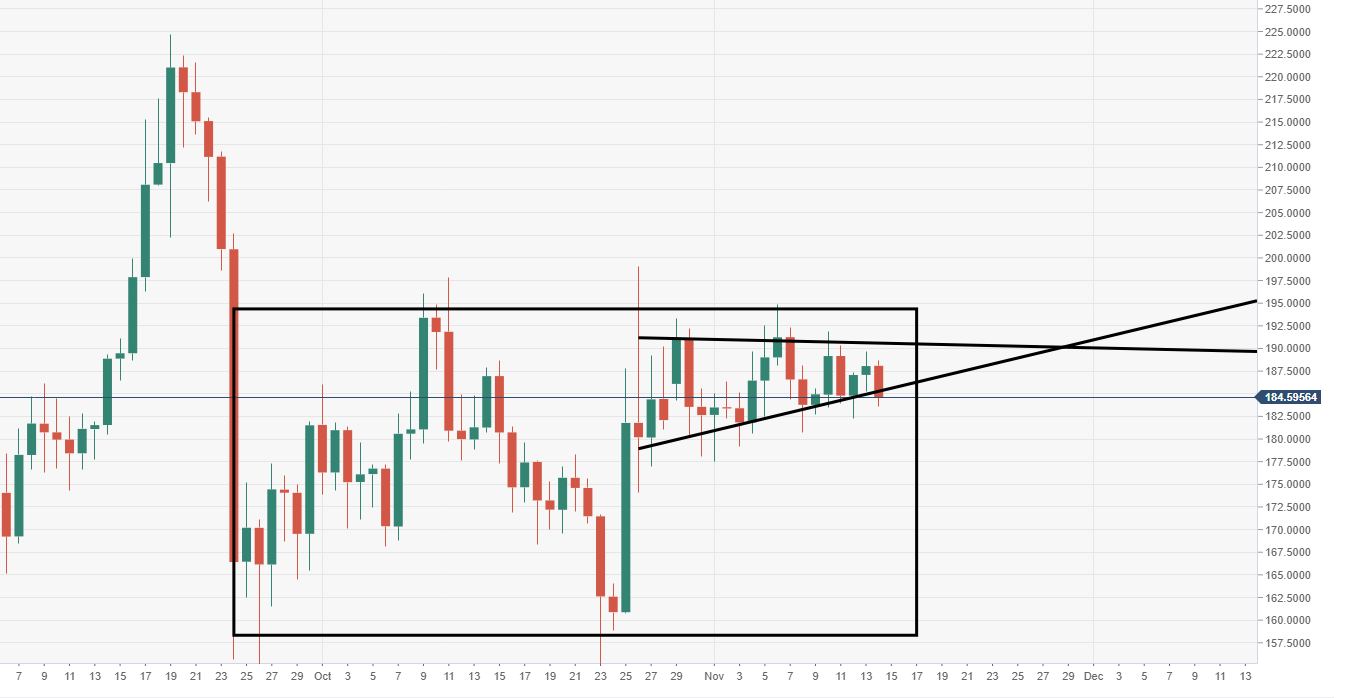
ETH/USD daily chart

The price is moving within a narrowing triangular structure, subject to a breach. 

.

Spot rate:                  184.60

Relative change:      -1.90%

High:                         187.34

Low:                          182.21

ETH/USD

Overview
Today last price184.54
Today Daily Change-3.51
Today Daily Change %-1.87
Today daily open188.05
 
Trends
Daily SMA20185.28
Daily SMA50180.06
Daily SMA100187.39
Daily SMA200214.26
 
Levels
Previous Daily High189.65
Previous Daily Low185.27
Previous Weekly High194.8
Previous Weekly Low179.18
Previous Monthly High199.04
Previous Monthly Low153.28
Daily Fibonacci 38.2%187.98
Daily Fibonacci 61.8%186.94
Daily Pivot Point S1185.67
Daily Pivot Point S2183.28
Daily Pivot Point S3181.29
Daily Pivot Point R1190.04
Daily Pivot Point R2192.03
Daily Pivot Point R3194.42

Author

Ken Chigbo

Ken Chigbo

Independent Analyst

Ken has over 8 years exposure to the financial markets. He started his career as an analyst, covering a variety of asset classes; forex, fixed income, commodities and equities.

More from Ken Chigbo
Share:

Editor's Picks

Ripple bulls defend key support amid waning retail demand and ETF inflows

XRP ticks up above $1.40 support, but waning retail demand suggests caution. XRP attracts $4 million in spot ETF inflows on Thursday, signaling renewed institutional investor interest.

Crypto Today: Bitcoin, Ethereum, XRP rebound as risk appetite improves

Bitcoin rises marginally, nearing the immediate resistance of $68,000 at the time of writing on Friday. Major altcoins, including Ethereum and Ripple, hold key support levels as bulls aim to maintain marginal intraday gains.

Bitcoin Weekly Forecast: No recovery in sight 

Bitcoin price continues to trade sideways between $65,729 and $71,746, extending its consolidation since February 7. US-spot ETFs record an outflow of $403.90 million through Thursday, pointing to the fifth consecutive week of withdrawals.

Pi Network Price Forecast: PI recovery stalls amid profit-taking

Pi Network tests 50-day EMA support on Friday, after a 5% decline the previous day. PiScan data shows large deposits on CEXs totaling over 4 million PI tokens in the last 24 hours, reflecting an exodus of investors taking profits.

Bitcoin Price Annual Forecast: BTC holds long-term bullish structure heading into 2026

Bitcoin (BTC) is wrapping up 2025 as one of its most eventful years, defined by unprecedented institutional participation, major regulatory developments, and extreme price volatility.

Bitcoin: No recovery in sight

Bitcoin (BTC) price continues to trade within a range-bound zone, hovering around $67,000 at the time of writing on Friday, and falling slightly so far this week, with no signs of recovery.