|

Ethereum technical analysis: Bulls attempt comeback after failing at $190-level

  • ETH/USD had a hugely bearish Monday, where it fell from $189.30 to $184.89.
  • Both SMA 20 and SMA 50 curves are acting as immediate market support.

ETH/USD daily chart

fxsoriginal

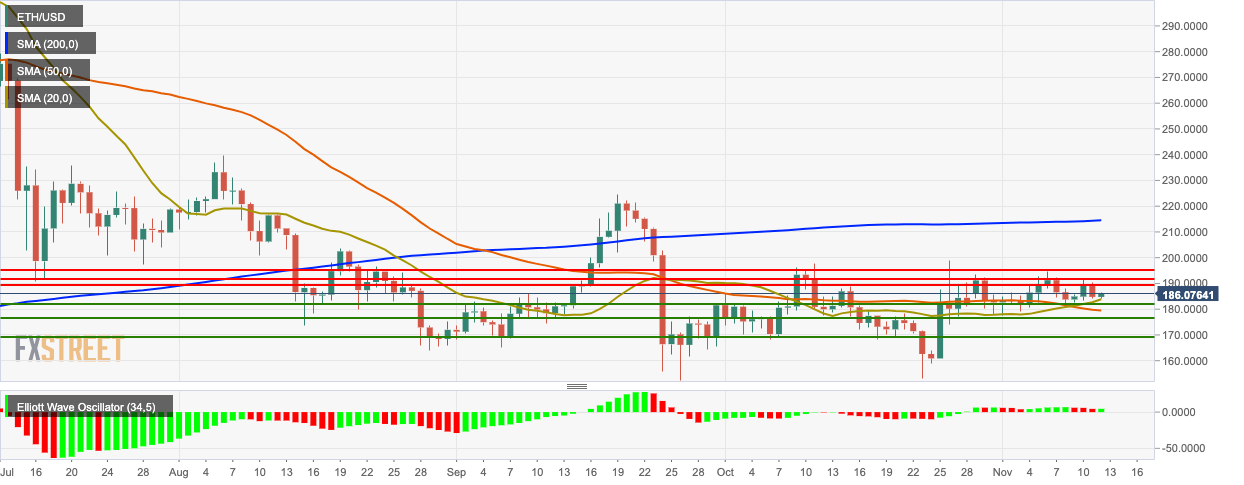
ETH/USD is currently priced at $185.80 following a bearish Monday wherein the price fell from $189.30 to $184.89. The price has found support at the 20-day Simple Moving Average (SMA 20) and SMA 50 curves. The SMA 20 has crossed over the SMA 50, which is a bullish sign. The Elliott Oscillator has had a green session, following three straight red sessions.

ETH/USD 4-hour chart

fxsoriginal

The 4-hour ETH/USD is sandwiched between the red Ichimoku cloud on the downside and the SMA 20 and SMA 50 curves on the upside. The Moving Average Convergence/Divergence (MACD) indicates bearish market momentum.

ETH/USD hourly chart

fxsoriginal

The hourly ETH/USD is floating below the 20-day, 50-day and 200-day Simple Moving Average (SMA 20, SMA 50 and SMA 200) curves. SMA 20 is acting as immediate market resistance. The 20-day Bollinger jaw has narrowed, which shows decreasing price volatility. The Relative Strength Index (RSI) indicator is trending around 45.45. 

Key Levels

ETH/USD

Overview
Today last price185.73
Today Daily Change0.94
Today Daily Change %0.51
Today daily open184.79
 
Trends
Daily SMA20182.7
Daily SMA50181.08
Daily SMA100187.99
Daily SMA200214.07
 
Levels
Previous Daily High190.28
Previous Daily Low183.96
Previous Weekly High194.8
Previous Weekly Low179.18
Previous Monthly High199.04
Previous Monthly Low153.28
Daily Fibonacci 38.2%186.38
Daily Fibonacci 61.8%187.87
Daily Pivot Point S1182.41
Daily Pivot Point S2180.03
Daily Pivot Point S3176.09
Daily Pivot Point R1188.73
Daily Pivot Point R2192.67
Daily Pivot Point R3195.05


Author

Rajarshi Mitra

Rajarshi Mitra

Independent Analyst

Rajarshi entered the blockchain space in 2016. He is a blockchain researcher who has worked for Blockgeeks and has done research work for several ICOs. He gets regularly invited to give talks on the blockchain technology and cryptocurrencies.

More from Rajarshi Mitra
Share:

Editor's Picks

Ripple bulls defend key support amid waning retail demand and ETF inflows

XRP ticks up above $1.40 support, but waning retail demand suggests caution. XRP attracts $4 million in spot ETF inflows on Thursday, signaling renewed institutional investor interest.

Crypto Today: Bitcoin, Ethereum, XRP rebound as risk appetite improves

Bitcoin rises marginally, nearing the immediate resistance of $68,000 at the time of writing on Friday. Major altcoins, including Ethereum and Ripple, hold key support levels as bulls aim to maintain marginal intraday gains.

Bitcoin Weekly Forecast: No recovery in sight 

Bitcoin price continues to trade sideways between $65,729 and $71,746, extending its consolidation since February 7. US-spot ETFs record an outflow of $403.90 million through Thursday, pointing to the fifth consecutive week of withdrawals.

Pi Network Price Forecast: PI recovery stalls amid profit-taking

Pi Network tests 50-day EMA support on Friday, after a 5% decline the previous day. PiScan data shows large deposits on CEXs totaling over 4 million PI tokens in the last 24 hours, reflecting an exodus of investors taking profits.

Bitcoin Price Annual Forecast: BTC holds long-term bullish structure heading into 2026

Bitcoin (BTC) is wrapping up 2025 as one of its most eventful years, defined by unprecedented institutional participation, major regulatory developments, and extreme price volatility.

Bitcoin: No recovery in sight

Bitcoin (BTC) price continues to trade within a range-bound zone, hovering around $67,000 at the time of writing on Friday, and falling slightly so far this week, with no signs of recovery.