Ethereum price shows bearish cues following December's PPI data release
- Ethereum price has witnessed no reaction in terms of price to the anticipated PPI data release.
- The Annual Producer Price Index (PPI) fell to 7.4% for November.
- A bearish divergence on the Relative Strength Index has been spotted, which could play out as a selloff in the coming days.

Ethereum price is currently trading at $1,274 as the decentralized smart-contract token has seen no reaction to the Producer Price Index data release. The PPI is a monthly report issued by the Bureau Of Labor Statistics (BLS) that gauges inflation. Specifically, the index measures wholesale prices that manufacturers and service suppliers charge over a period and utilizes a weighted algorithm to interpret price fluctuations contributing to inflation.
Ethereum price has traders sidelined
Throughout the year, inflation metrics have significantly impacted price fluctuations in risk assets like stocks, commodities and cryptocurrencies. In November, several stocks witnessed a surge after the Consumer Price Index CPI) came in lower than expected. The CPI is another metric used to gauge inflation by accounting for the price of goods and services paid by consumers.
The volatility upticks witnessed during monthly inflation reports have prompted traders to adopt a reactionary trading method. On several occasions, risk assets, including Ethereum, have fluctuated by 10% or more during BLS release dates and then stabilized in price within 24 hours.
On December 9, The PPI data release for final demand in the US came in at 7.4%, a .7% decline from November's 8.1% reading. Still, historically the reading is relatively high, meaning inflation is still prevalent in the United States. As a result, the uptick in inflation adds weighted pressure to all risk assets for months to come. The ETH price has not seen any volatile price movements during The New York trading session, leaving day traders to remain sidelined in anticipation of a move.
Ethereum price remains rangebound, spending most of its' time since November 9 between $1,150 and $1,300. A breach above $1,300 could catalyze a move towards the "Golden Pocket" 61.8% Fibonacci level at $1,416 for a 13% increase from the current market value. The Fibonacci level is extracted by measuring Etheruem's swing high at $1,680 to swing low at $1,233 in November.
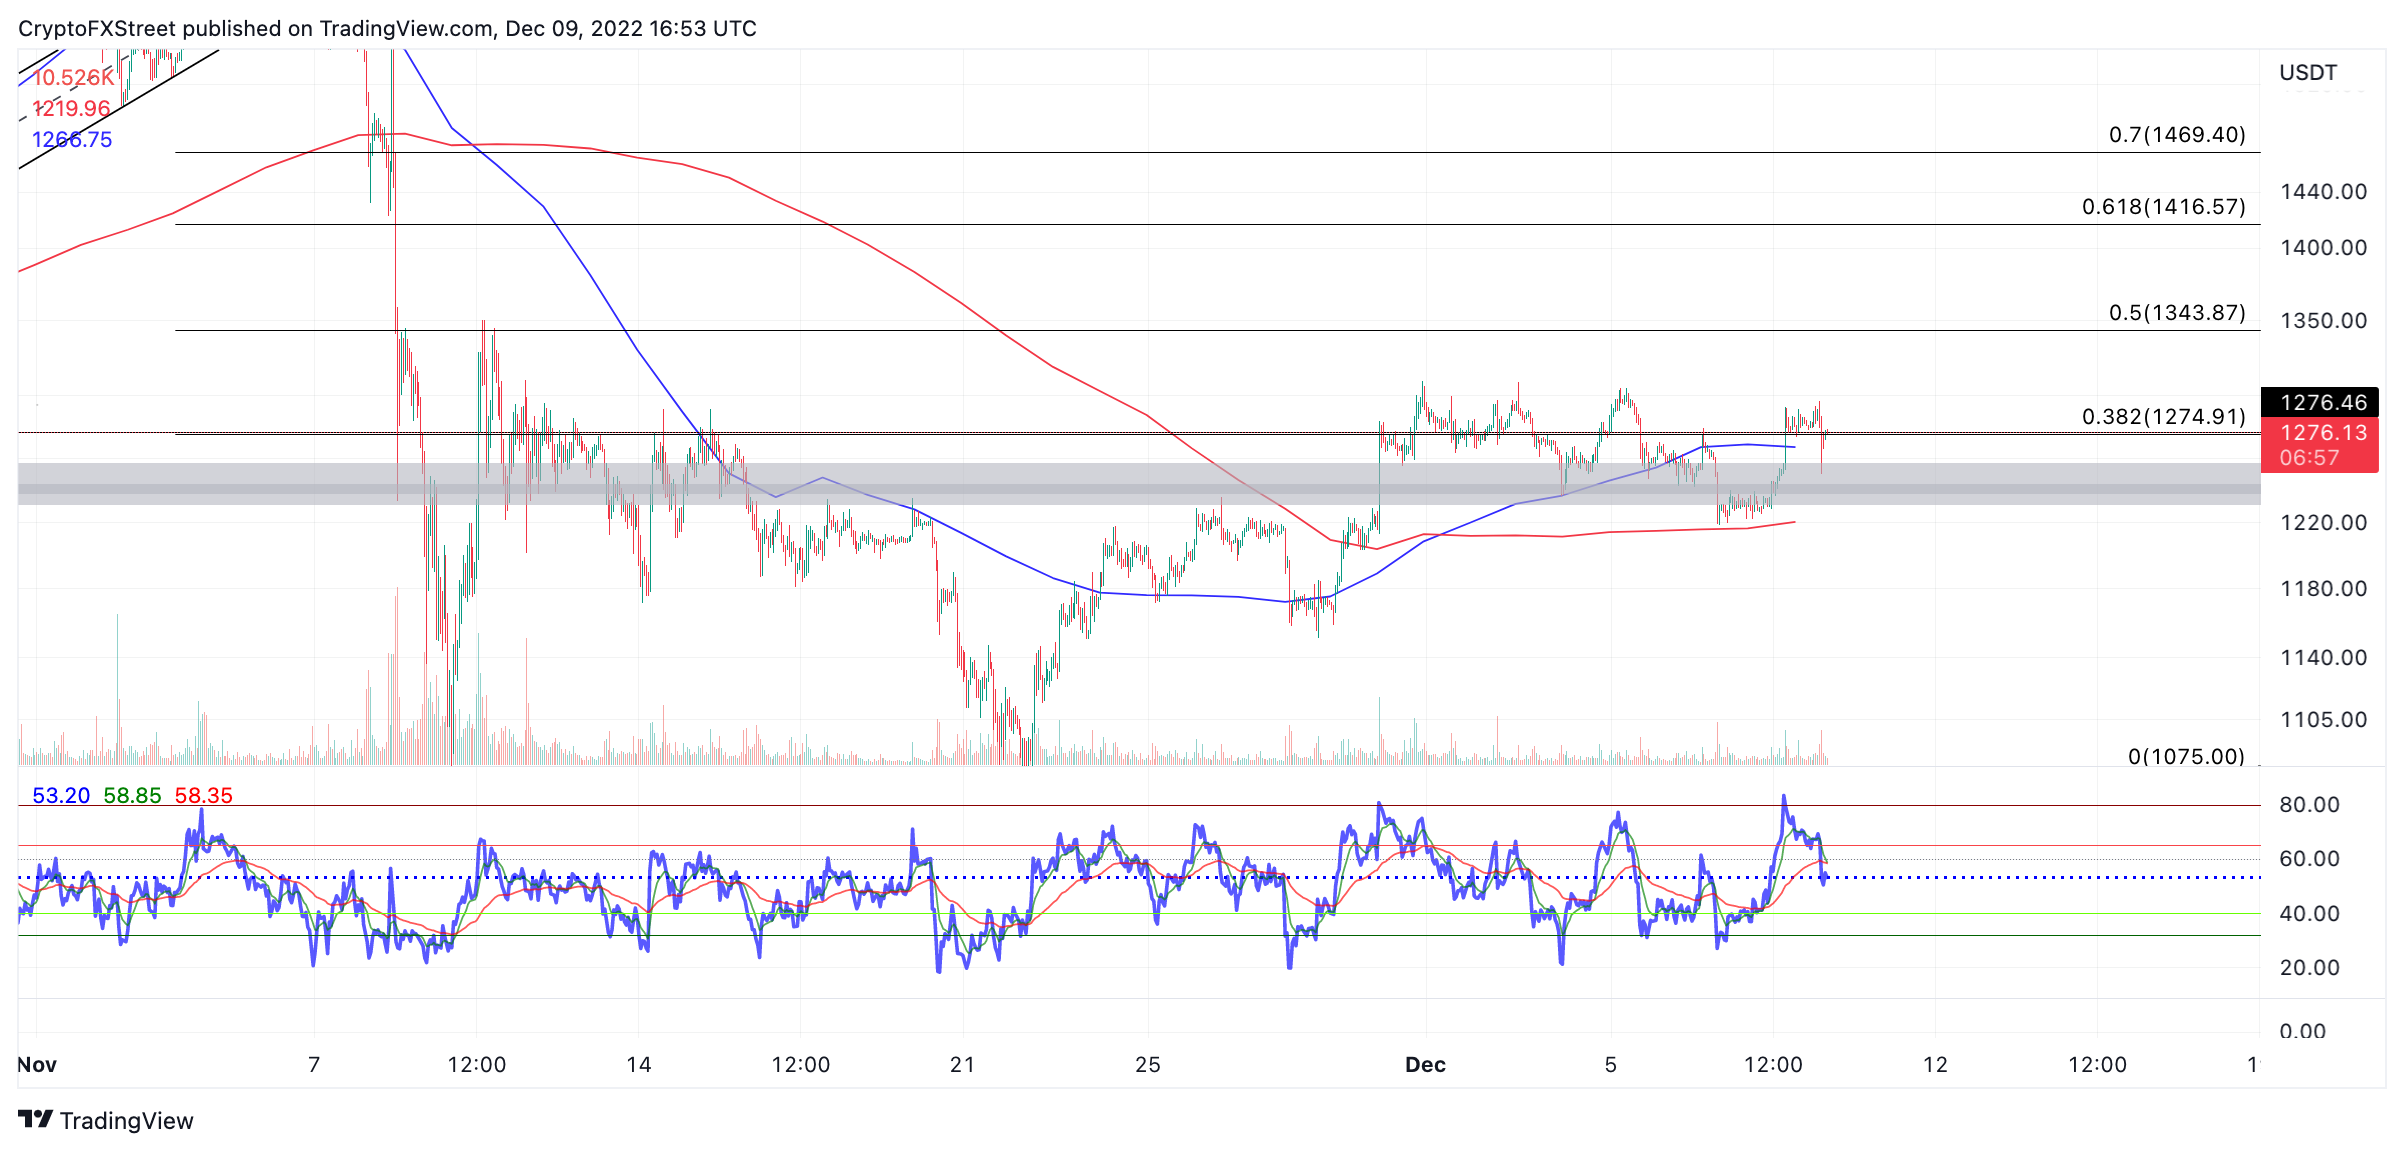
ETH/USDT 1-Hour Chart
On The contrary, a breach below the 21-day simple moving average at $1,220 could induce a retest of the lower half of the coiling range at $1,150 and potentially $1,100, resulting in up to a 12% decline from the current Ethereum price.
It is worth noting that a bearish divergence on the Relative Strength Index has been issued in the 1-hour time frame following the PPI data release. The Relative Strength Index is an indicator used to gauge the strength of market participants in the market. The indicators may suggest bears are strongly entering the market following the uptick in inflation metrics. Although the price has not fallen yet, the technicals are leaning more in the bears' favor due to the RSI's reading.
Author

Tony M.
FXStreet Contributor
Tony Montpeirous began investing in cryptocurrencies in 2017. His trading style incorporates Elliot Wave, Auction Market Theory, Fibonacci and price action as the cornerstone of his technical analysis.


