Monero Price Forecast: XMR rally to $400 shows signs of potential short squeeze
- Monero trades near $400, up over 2%, marking the third consecutive day of gains.
- A surge in XMR futures Open Interest with negative funding rates signals short positional buildup.
- The technical outlook for Monero remains mixed, as the privacy coin trades within a larger symmetrical triangle.

Monero (XMR) extends the gains to $400 on Wednesday, recording a 10% rise so far this week. Still, the derivatives market lacks confidence in XMR’s rally, leading to a bearish positional buildup that anticipates a collapse. On the technical side, the privacy coin is targeting a resistance trendline to break out of a symmetrical triangle and extend the rally.
XMR derivatives: Short squeeze or another bull trap?
CoinGlass’s data shows a nearly 5% rise in XMR futures Open Interest (OI), to $56.24 million in the last 24 hours, indicating a positional buildup across both long and short positions. Such buildups are often leveraged-based as traders increase their risk exposure amid anticipations of a sharp move.
The negative OI-weighted funding rate of -0.0327% indicates bears are highly confident, paying premiums to hold short positions. These bets are likely based on the two previous rejections at $471 and $441 on November 9 and 30, respectively.
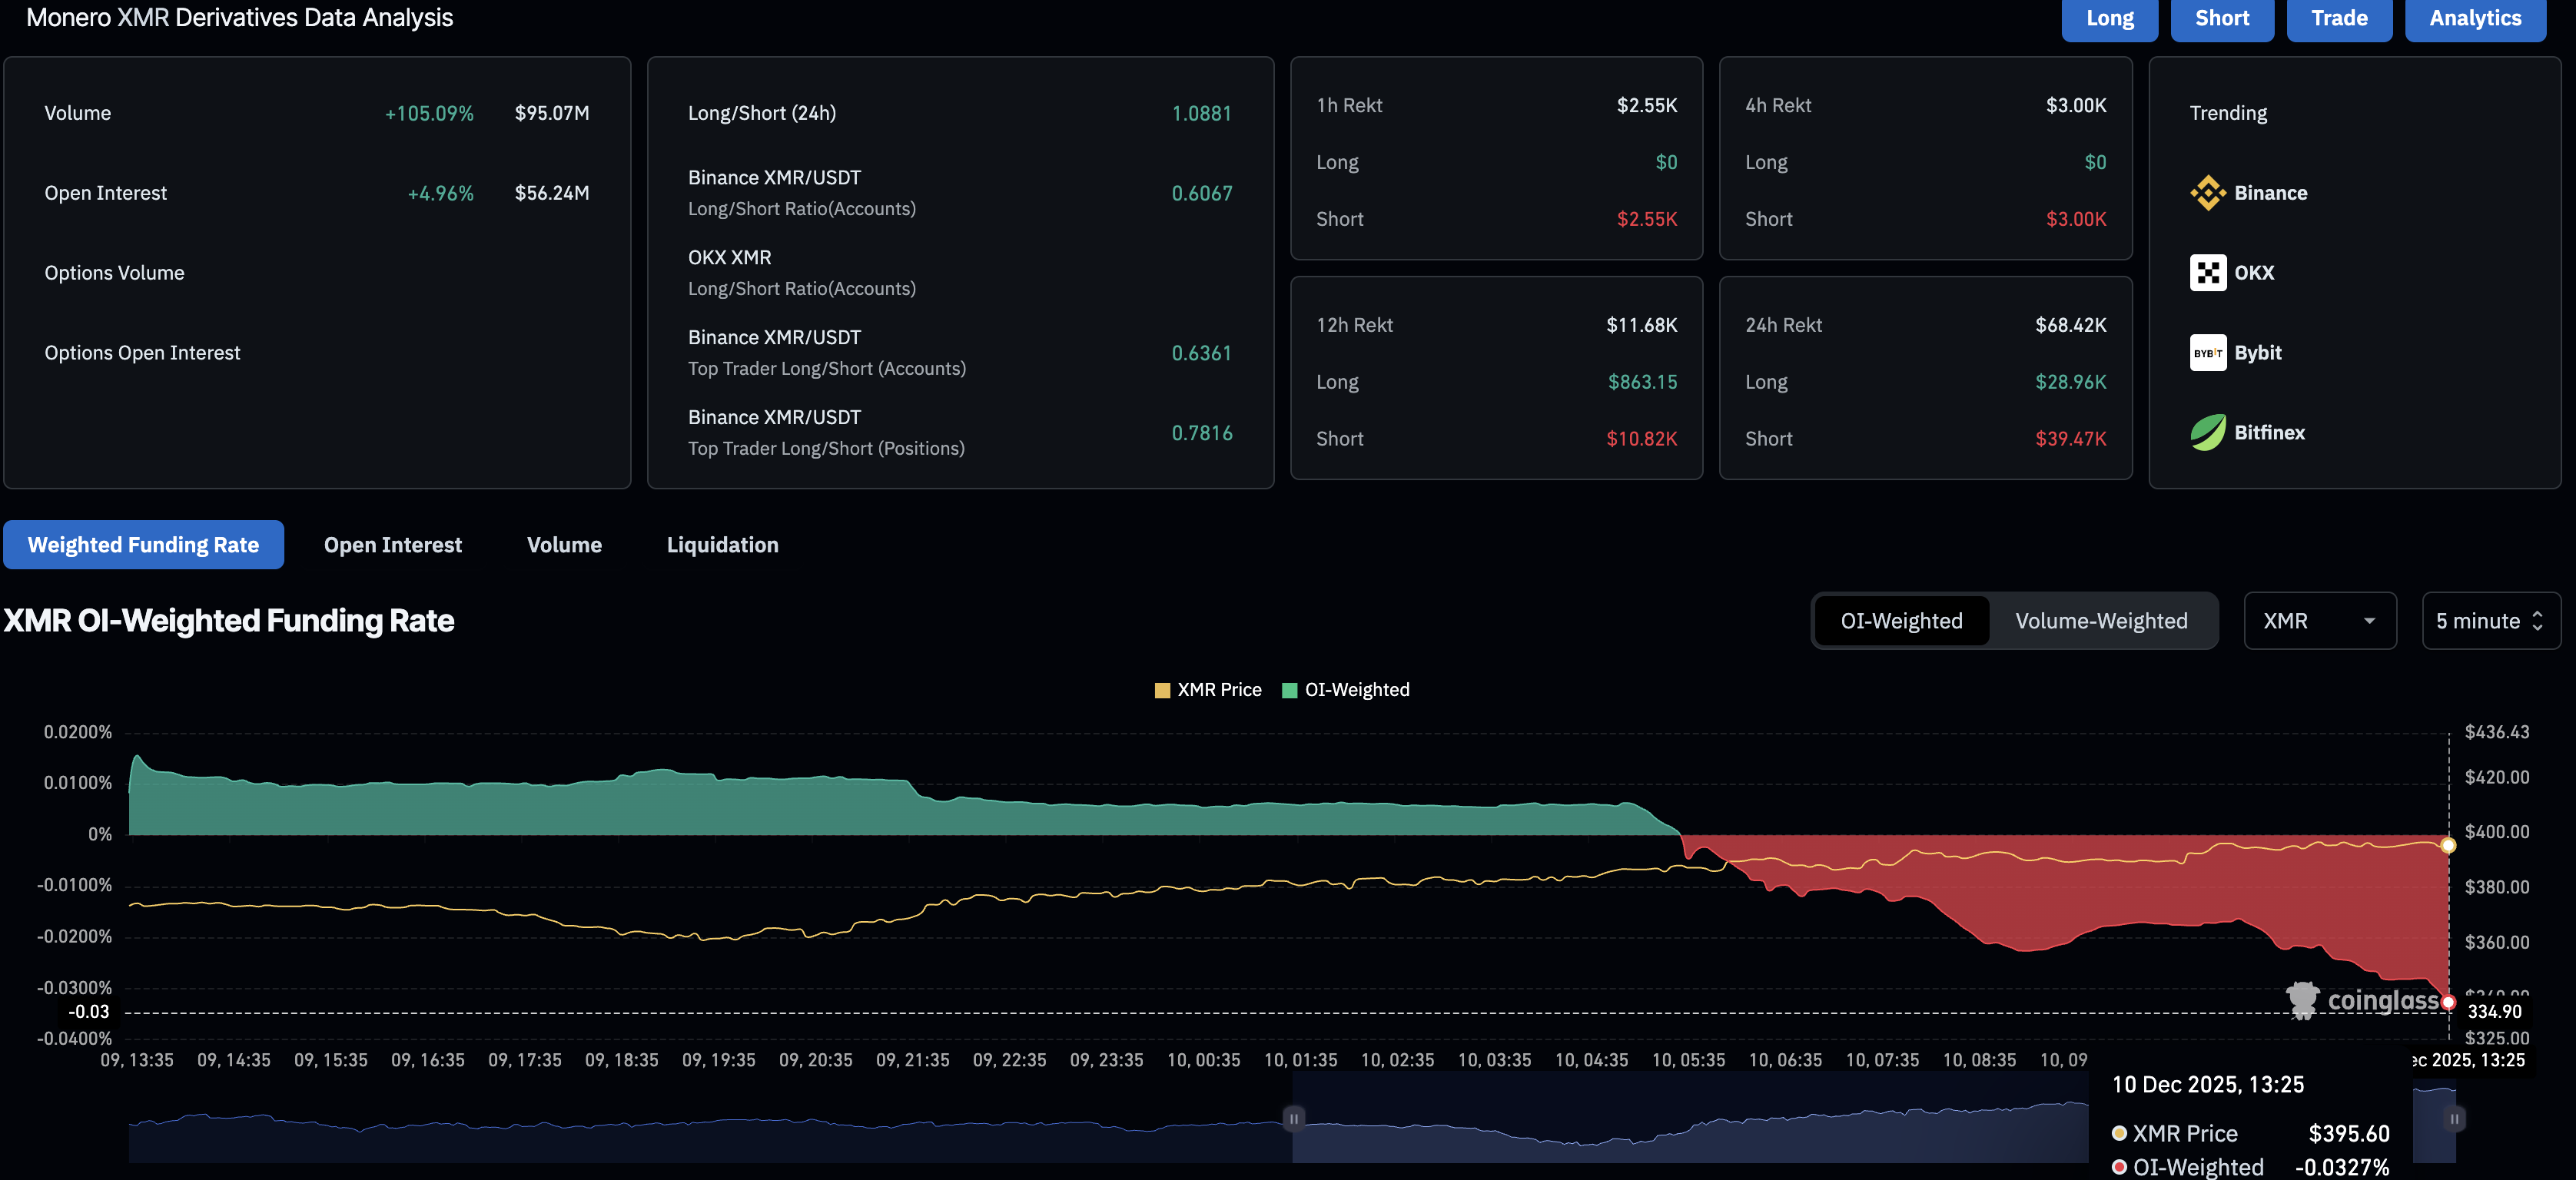
However, the bearish buildup in Monero derivatives risks liquidation if XMR continues to rally. Notably, the upcoming US Federal Reserve (Fed) monetary policy decision, where the central bank is expected to cut interest rates by 25 basis points, could boost market sentiment. In such a case, Monero could experience a short squeeze, further extending the recovery.
Technical outlook: Will Monero break out of a triangle pattern?
Monero extends the gains for the third consecutive day by over 2% at press time on Wednesday, aiming for the December 2 high at $428. This level aligns with a resistance trendline formed by connecting the highs of November 9 and 30.
Additionally, a support trendline connecting the November 21 and December 9 lows converges with the resistance trendline, forming a symmetrical triangle pattern on the daily chart.
If the privacy coin clears $428, it could confirm the bullish breakout of the triangle pattern, potentially targeting the R1 Pivot Point at $500.
The Relative Strength Index (RSI) at 53 spikes above the halfway line with more room to the upside, indicating further bullish potential before reaching the overbought zone.
The Moving Average Convergence Divergence (MACD) approaches the signal line, indicating reduced bearish pressure. If MACD crosses above the red line, it could confirm renewed bullish momentum and improve the odds of a breakout rally.
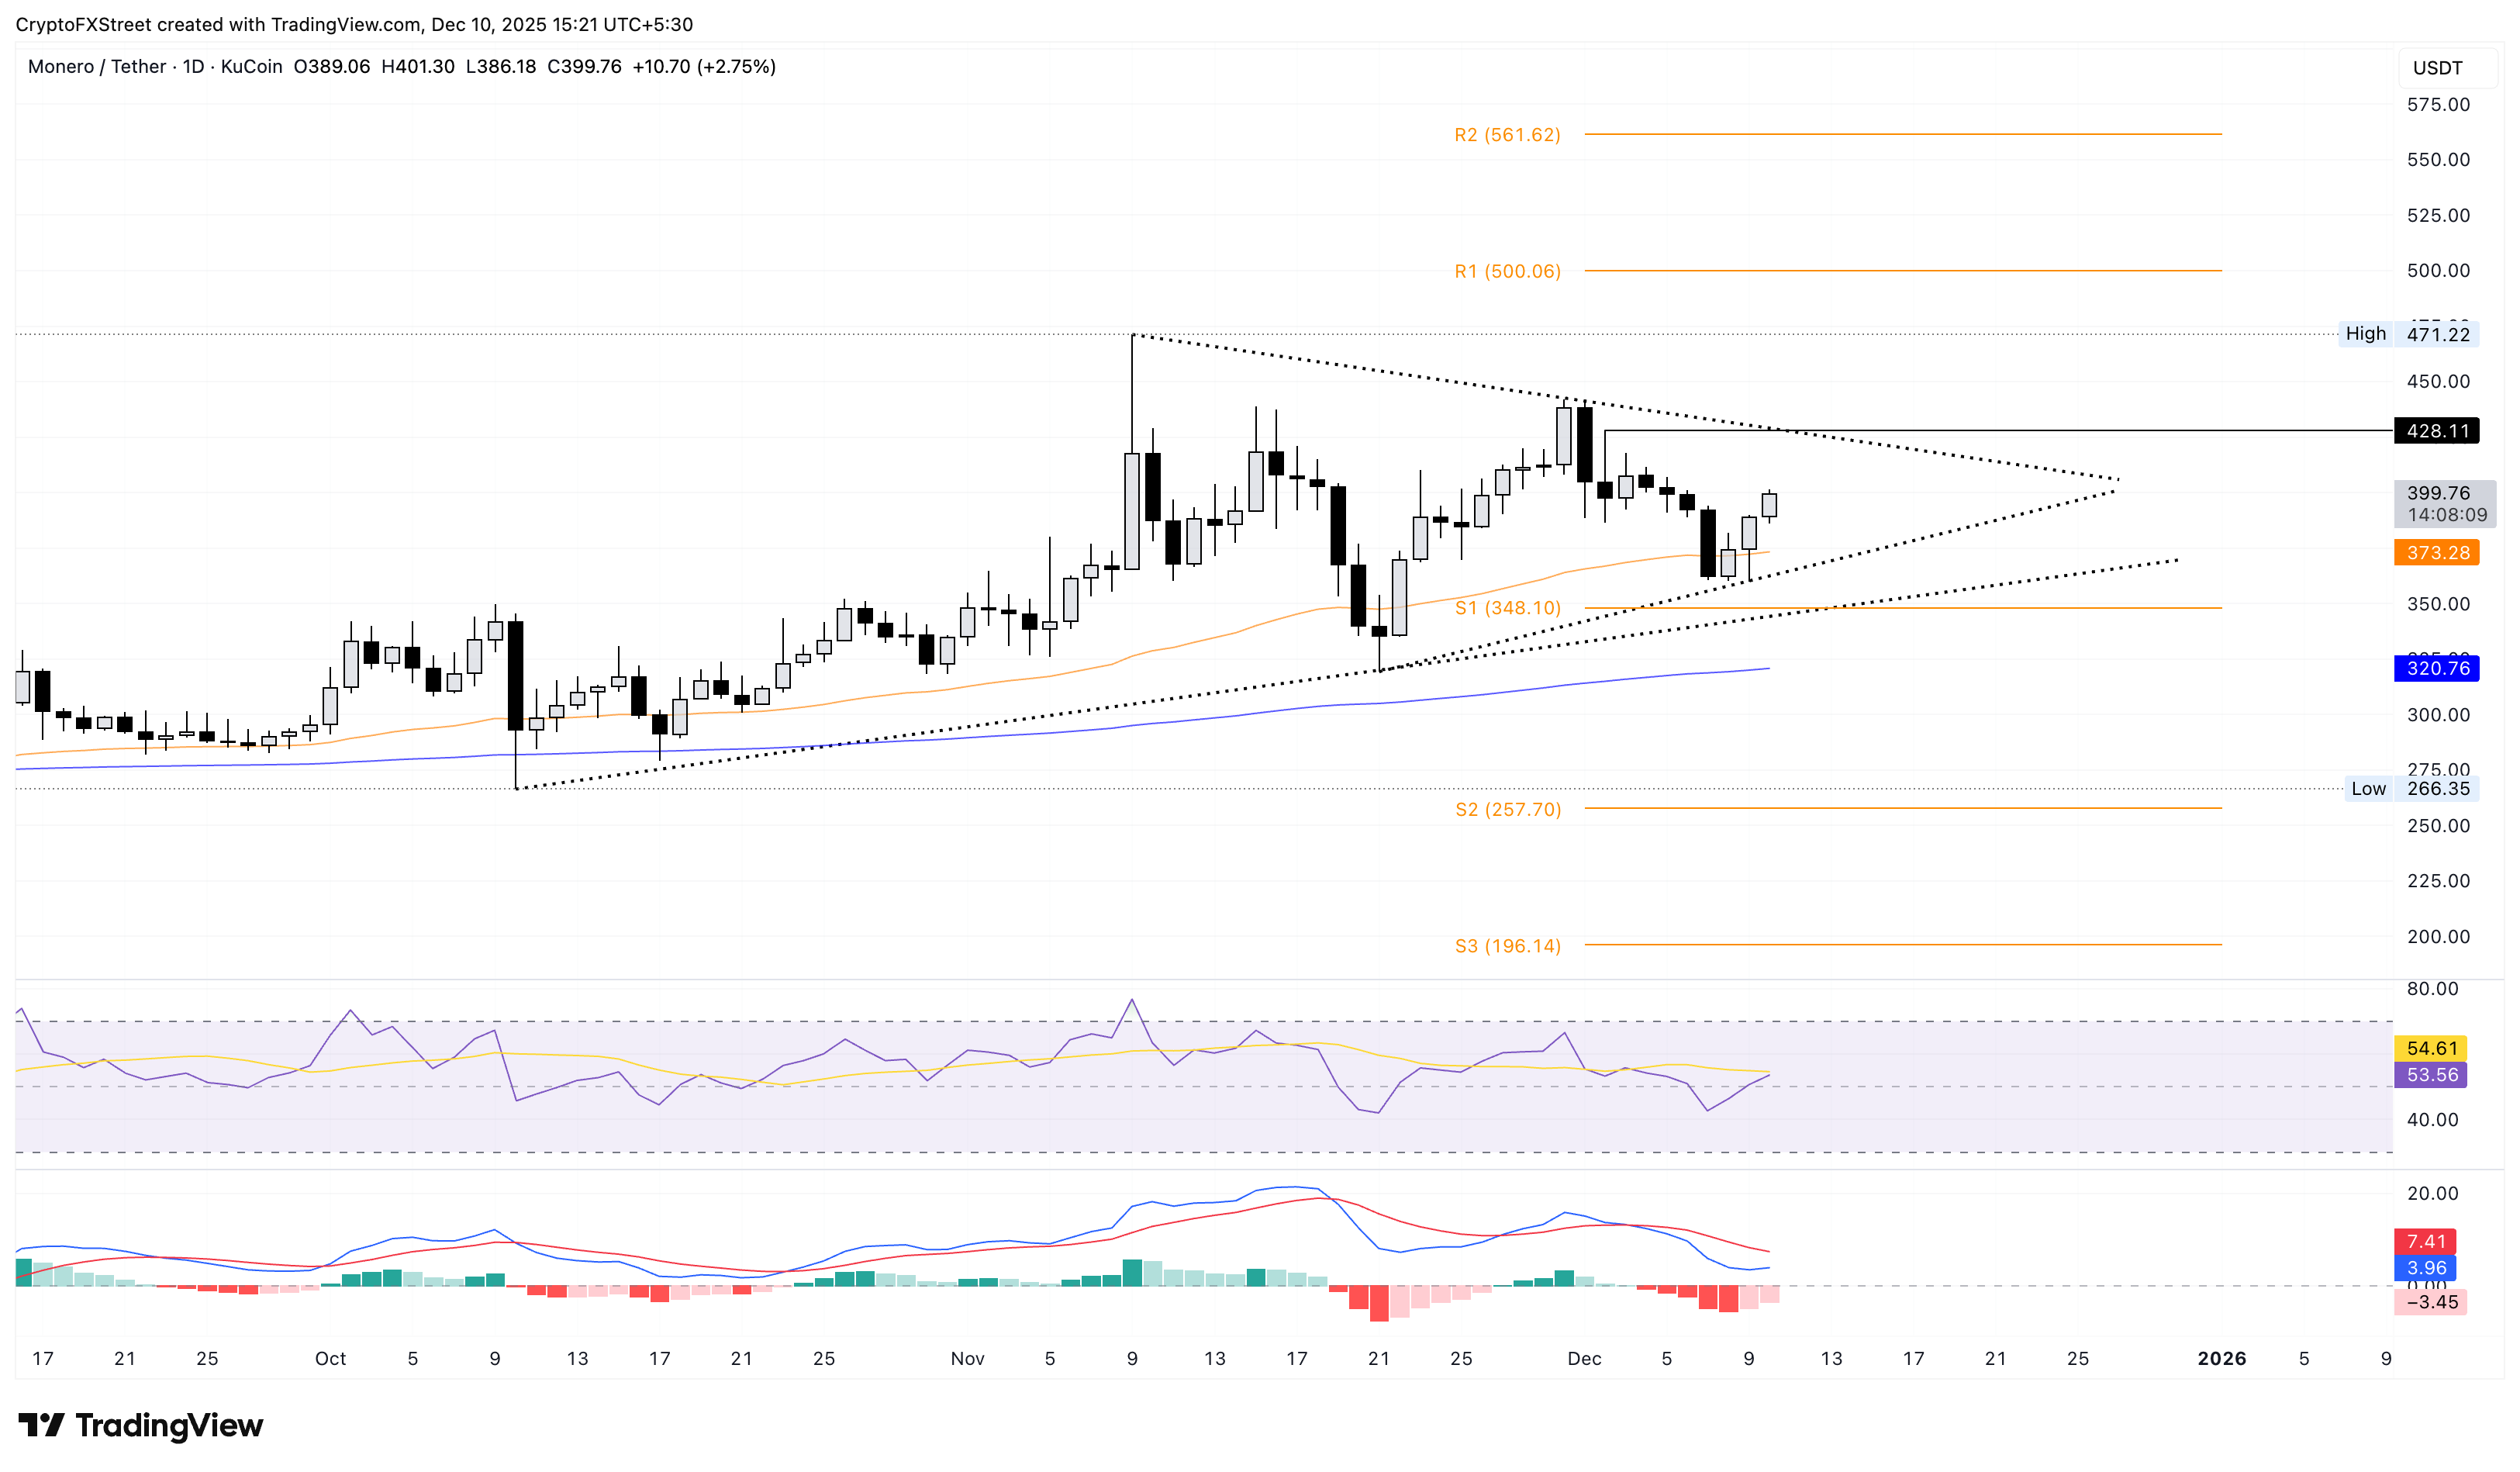
Looking down, the 50-day Exponential Moving Average (EMA) at $373 and the S1 Pivot at $348 could serve as support levels. Meanwhile, the 200-day EMA at $320 stands as the final line of defense.
Author

Vishal Dixit
FXStreet
Vishal Dixit holds a B.Sc. in Chemistry from Wilson College but found his true calling in the world of crypto.



