Ethereum Price Prediction: Sell the bounce amid a potential bear flag
- Ethereum consolidates Friday’s sell-off to 115.80 in Saturday’s trading.
- Last week’s downtrend stays intact amid potential bear flag on the daily chart.
- A retest of 115.00 remains on the cards for the ETH/USD bears.

Having witnessed a volatile trading session on Friday, Ethereum (ETH/USD) is seen consolidating in $10 range so far this Saturday. The second-most traded cryptocurrency lost almost $40 a day before, having rallied as high as $153.32 before crashing to $115.80. The coin did manage to reverse a part of the previous losses, but is still not out of the woods yet, as the recovery lost legs near 137.50 region.
At the time of writing, Ethereum is down nearly 1.50% around 131.50, enjoying a market capitalization of about $ 14.44 billion.
Short-term technical outlook
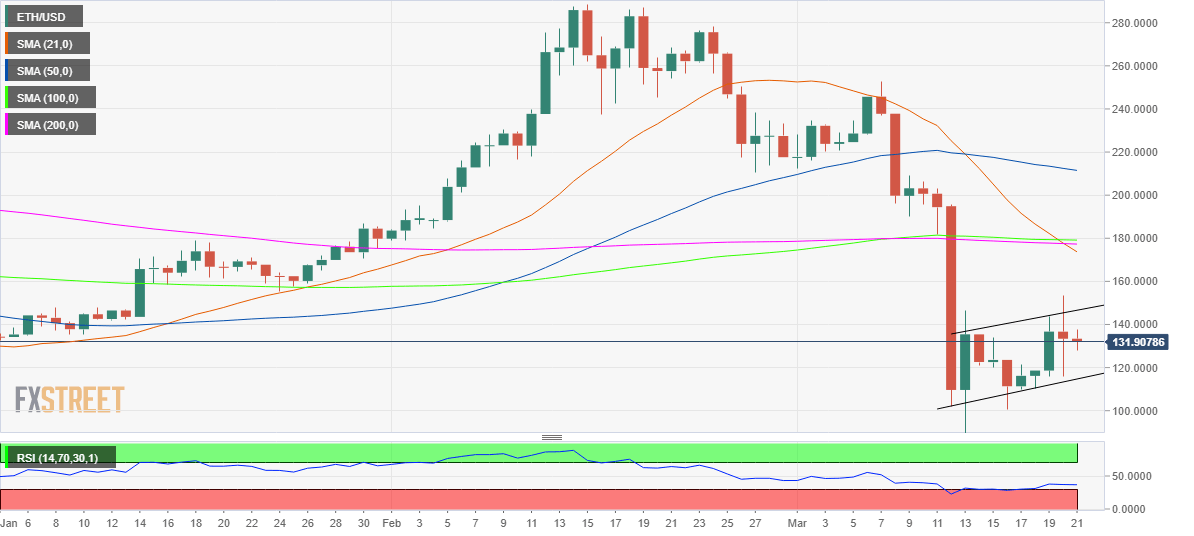
As observed in the daily chart, the price traverses within a rising channel, charting a potential bearish flag pattern. The bearish continuation pattern will get confirmed only on a daily closing below the channel support at 114.70.
Last week’s downtrend will resume below the latter, opening floors for a test of the immediate support seen around 110 levels. A failure to defend the last will put the March 13 low of 89.65 at risk. The daily Relative Strength Index (RSI) trades flat below the mid-line and wells above the oversold territory, suggesting that there is further room for declines. Further, adding strength to the bearish bias, the spot trades below all the major daily Simple Moving Averages (DMA).
On the flip side, the bulls need to portray a sustained breakthrough the immediate resistance located at 146.60, the rising channel resistance, above which the 175.180 area will test the bulls’ commitment. That area is where the horizontal 100 and 200-DMAs intersect with the bearish 21-DMA.
All in all, the path of least resistance appears to the downside amid a bearish pattern formation and a cluster of strong upside barriers stacked up for the bulls to beat.
ETH/USD daily chart
ETH/USD key levels to consider
Author

Dhwani Mehta
FXStreet
Residing in Mumbai (India), Dhwani is a Senior Analyst and Manager of the Asian session at FXStreet. She has over 10 years of experience in analyzing and covering the global financial markets, with specialization in Forex and commodities markets.


