Ethereum Price Prediction: ETH/USD levels to watch, following rejection at $450 – Confluence Detector
- Ethereum bounces off support at $415 but is struggling to build momentum above $420.
- ETH/USD upward price action will encounter higher seller congestion at $428 and $432 confluences respectively.

Ethereum price remarkably rose to new yearly highs on Monday as it closed in on the critical level at $450. A two year high was traded at $447 before a reversal came into the picture. Meanwhile, ETH/USD is trading at $422 after retesting and confirming support at $415. The recovery above $420 seems not strong enough and it is apparent that bulls will continue to struggle with building gains towards $430.
Technically, the trend is turning bearish. The RSI, for instance, is almost crossing under the overbought line. If the negative gradient continues, it would not be easy to keep ETH/USD above $415 let alone $420. The Elliot Wave Oscillator also reinforces the increasing sellers’ grip picture a newly printed bearish session. In other words, the path of least resistance remains downwards.
ETH/USD daily chart
-637334016702561188.png)
On the flip side, the wide gap made by the 50-day SMA above the 200-day SMA illustrates that buying pressure is still present only that it is not enough to pull Ether to higher levels past $430. If the short term support at $420 is held in place, we can expect bulls to build on it for action to higher levels in the near term.
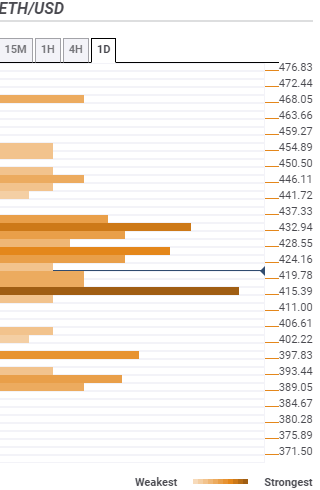
Ethereum confluence levels
Resistance one: $424 – Highlighted by the previous low 4-hour, the SMA 10 15-minutes and the previous high 15-minutes.
Resistance two: $428 – Home to the SMA 50 15-minutes, SMA ten 1-hour, the Bollinger Band 15-minutes middle curve and the Fibonacci 23.6% one-week.
Resistance three: $432 – This zone is reinforced by the SMA five one-day, the Bollinger Band 1-hour upper and the pivot point one-month resistance two.
Support one: $419 – A relatively strong buyer congestion area highlighted by the Bollinger Band 4-hour upper and the Fibonacci 23.6% one-day.
Support two: $415 – This is the strongest buyer congestion zone and home to the SMA ten one-day, the SMA 200 1-hour, the previous low one-day and the Fibonacci 38.2% one-week.
Support three: $397 – Zone highlighted by the Fibonacci 61.8% one-week and the Bollinger Band one-day middle curve.
Author

John Isige
FXStreet
John Isige is a seasoned cryptocurrency journalist and markets analyst committed to delivering high-quality, actionable insights tailored to traders, investors, and crypto enthusiasts. He enjoys deep dives into emerging Web3 tren


