Ethereum price heads north to print new yearly high at $3,700
- Ethereum price sees a bullish impulse as Bank of Japan steps in to curb treasury yields in order to support markets.
- ETH price faces tough resistance at $3,391.52 and the 200-day SMA.
- Expect a 10% jump into the week as more tailwinds are added to the rally.

Ethereum (ETH) price is on the cusp of performing one of its best weeks in 2022 as markets jump on additional favourable tailwinds. With positive sentiment in equity markets still spilling over into cryptocurrencies, additional tailwinds are now also coming from geopolitics as peace talks are set to restart this week with some territorial concessions by Ukraine towards Russia, which could open the possibility of signing a peace deal together with the Bank of Japan to curb interest rate yields in a move to support financial markets. Expect these tailwinds to push ETH price above $3,391.52, to face the 200-day Simple Moving Average (SMA) at $3,488.00 before touching $3,687.17 and printing new highs for 2022.
Ethereum price set for 10% gains this week
Ethereum price is seeing a killer rally as bulls storm out of the gates on Sunday, making just shy of a 5% move intraday. The bulls are seeing prices open this morning at $3,391.52 with the R1 resistance and a historic pivotal level both in close proximity. Due to the sheer steepness of the rally, the Relative Strength Index (RSI) has breached the overbought area. This means that bulls will face rejection once hitting either the R1 or the historical level, resulting in a short fade.
ETH price will see a breach through $3,391.52 once the RSI has taken a pause and is pulled back down and out of the ‘overbought’ zone. Expect to see momentum build further in the front-running of another breakthrough this week as the Ukrainian olive branch could provide a catalyst resulting in some positive results and a possible cease-fire. That would result in bulls piercing through $3,391.5, facing the 200-day SMA and then hitting $3,687.17 as more tailwinds are added with headlines hitting the wires of possible breakthroughs in the peace process.
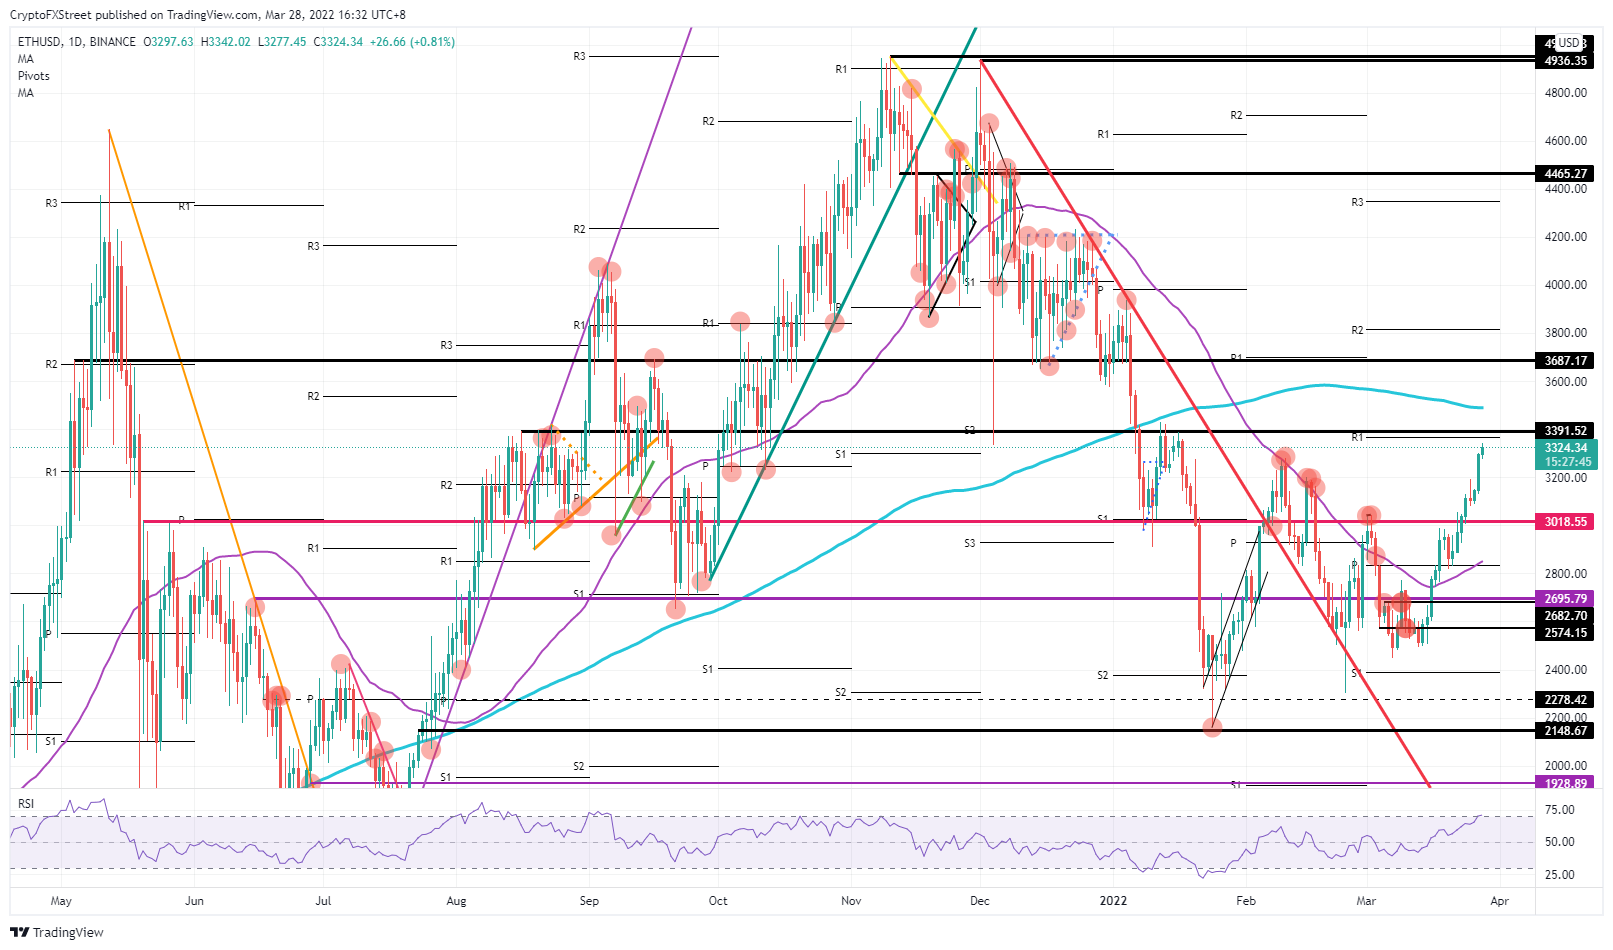
ETH/USD daily chart
Risk to the downside comes with a firm rejection at $3,391.52, and the monthly R1 providing bears two reasons to jump in and defend the price action from running away from them. With the RSI being overbought, few new buyers will want to step in at these elevated levels. Bears will be able to easily take the overweight and see a push-back towards $2,800 with the 55-day SMA and the monthly pivot catching the drop in price action in case $3,018.55 is unfit to provide enough support for the short-fall.
Author

Filip Lagaart
FXStreet
Filip Lagaart is a former sales/trader with over 15 years of financial markets expertise under its belt.



