Ethereum Price Forecast: ETH ETFs post first weekly inflows since February

Ethereum price today: $1,800
- Ethereum ETFs recorded weekly net inflows of $157.1 million this week, their first positive week since February.
- The institutional buying pressure follows President Trump's softening rhetoric on China tariffs and Paul Atkins assuming the role of SEC Chair.
- ETH retested the $1,800 key resistance amid investors' indecision near the 50-day SMA.
Ethereum (ETH) recovered the $1,800 price level on Saturday after US spot Ether ETFs (exchange-traded funds) recorded their first weekly inflows since February.
Ethereum bulls push ETH ETFs to first weekly inflows since February
Ethereum ETFs recorded net inflows of $104.1 million on Friday — their highest daily inflow since February 4, per SoSoValue data. As a result, the products saw a weekly net inflow of $157.1 million, which also marks their highest net buying activity since February.
The weekly inflow was dominated by Fidelity's FETH, BlackRock's ETHA and Grayscale's ETH.
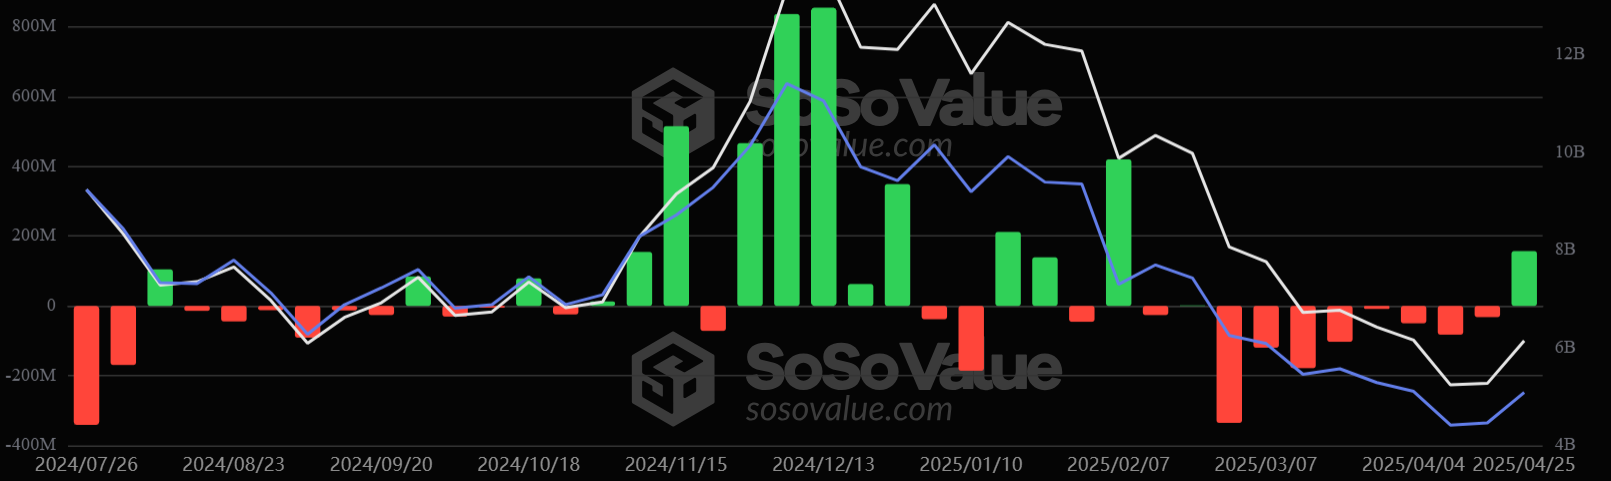
US spot ETH ETFs weekly flows. Source: SoSoValue
The increased buying pressure from institutional investors follows President Trump's softening rhetoric concerning the US-China trade war and Paul Atkins assuming the role of Securities and Exchange Commission (SEC) Chair during the week.
Considering Atkins' history of working with crypto companies, most crypto community members anticipate he would apply a soft approach to cryptocurrency regulation.
In an SEC crypto roundtable on Friday, Atkins noted that he would work with Congress and colleagues to establish a "reasonable and targeted" framework for digital assets.
This comes at a time when ETH ETF issuers — including Fidelity, Grayscale, 21Shares and Bitwise — await the SEC's decision on exchange filings to permit staking in their products. Analysts expect staking to boost inflows into ETH ETFs, which could spark a potential rally in ETH.
Ethereum Price Forecast: ETH on the verge of clearing $1,800 key level
Ethereum sustained $45.18 million in futures liquidations in the past 24 hours, per Coinglass data. The total amount of long and short liquidations is $15.37 million and $29.82 million, respectively.
ETH is retesting the $1,800 key resistance and 50-day Simple Moving Average (SMA) after three consecutive days of seeing a rejection near it. The consecutive small-bodied candlesticks near $1,800 signal indecision among bulls and bears.
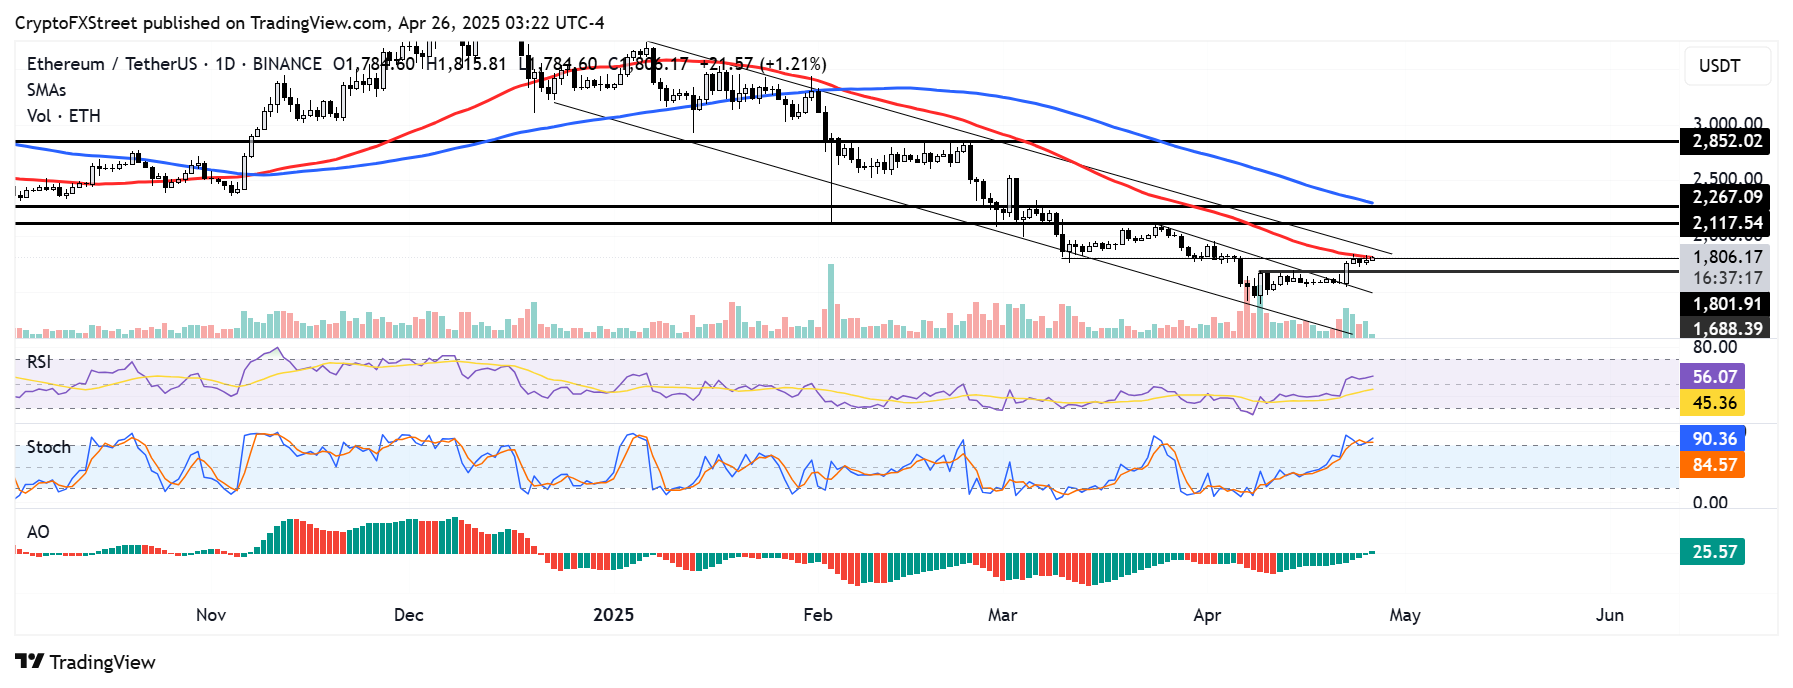
ETH/USDT daily chart
A firm close above the $1,800 level, 50-day SMA and descending channel's upper boundary could mark the beginning of a major recovery for ETH. Such a move could see ETH tackle the resistance at $2,100.
On the downside, ETH could find support at $1,688. A decline below $1,688 could send the top altcoin toward a descending trendline extending from March 25.
The Relative Strength Index (RSI) and Awesome Oscillator (AO) histogram bar are above their neutral levels. This marks the first time the AO crossed above its midline in 2025. A daily close of the AO above its neutral level could strengthen ETH's bullish momentum. Meanwhile, the Stochastic Oscillator (Stoch) is in the overbought region, indicating ETH could see a potential short-term pullback.
Author

Michael Ebiekutan
FXStreet
With a deep passion for web3 technology, he's collaborated with industry-leading brands like Mara, ITAK, and FXStreet in delivering groundbreaking reports on web3's transformative potential across diverse sectors. In addition to




