Ethereum Price Forecast: ETH bulls set sights on new record high targeting $6,000
- Ethereum price is gearing up for a new all-time high as two significant bullish chart patterns have emerged.
- The governing technical patterns present optimistic targets at $6,015 and $6,365.
- A daily close above $3,960 would add credence to the bulls’ aspirations toward $6,000.

Ethereum price is hovering around a key support level which has previously acted as resistance for ETH, as the bulls catch their breath before the token resumes its rally. As long as the second-largest cryptocurrency by market capitalization holds above $3,960, a 60% surge is still on the radar.
Ethereum price eyes 60% ascent
Ethereum price has printed two major bullish technical patterns on the daily chart, an ascending parallel channel and a cup-and-handle pattern. The former chart pattern indicates that ETH has been consistently reaching higher highs and higher lows since mid-June, presenting an optimistic outlook for the token.
Based on the first governing chart pattern, ETH is likely to tag the upper boundary of the channel at $6,015, coinciding with the 161.8% Fibonacci extension level, representing a 48% climb.
The cup-and-handle chart pattern suggests that the projected target for Ethereum price is at $6,365, forecasting a 60% rally. While the two technical patterns establish an optimistic outlook for ETH, the token may be confronted by a headwind at its all-time high at $4,369, corresponding to the middle boundary of the parallel channel.
Additional hurdles may emerge at the 127.2% Fibonacci extension level at $5,092, then at the 161.8% Fibonacci extension level at $6,015.
Given the reinforcement of the two optimistic chart patterns presented on the ETH daily chart, retracements for Ethereum price may not be significant even if selling pressure arises.
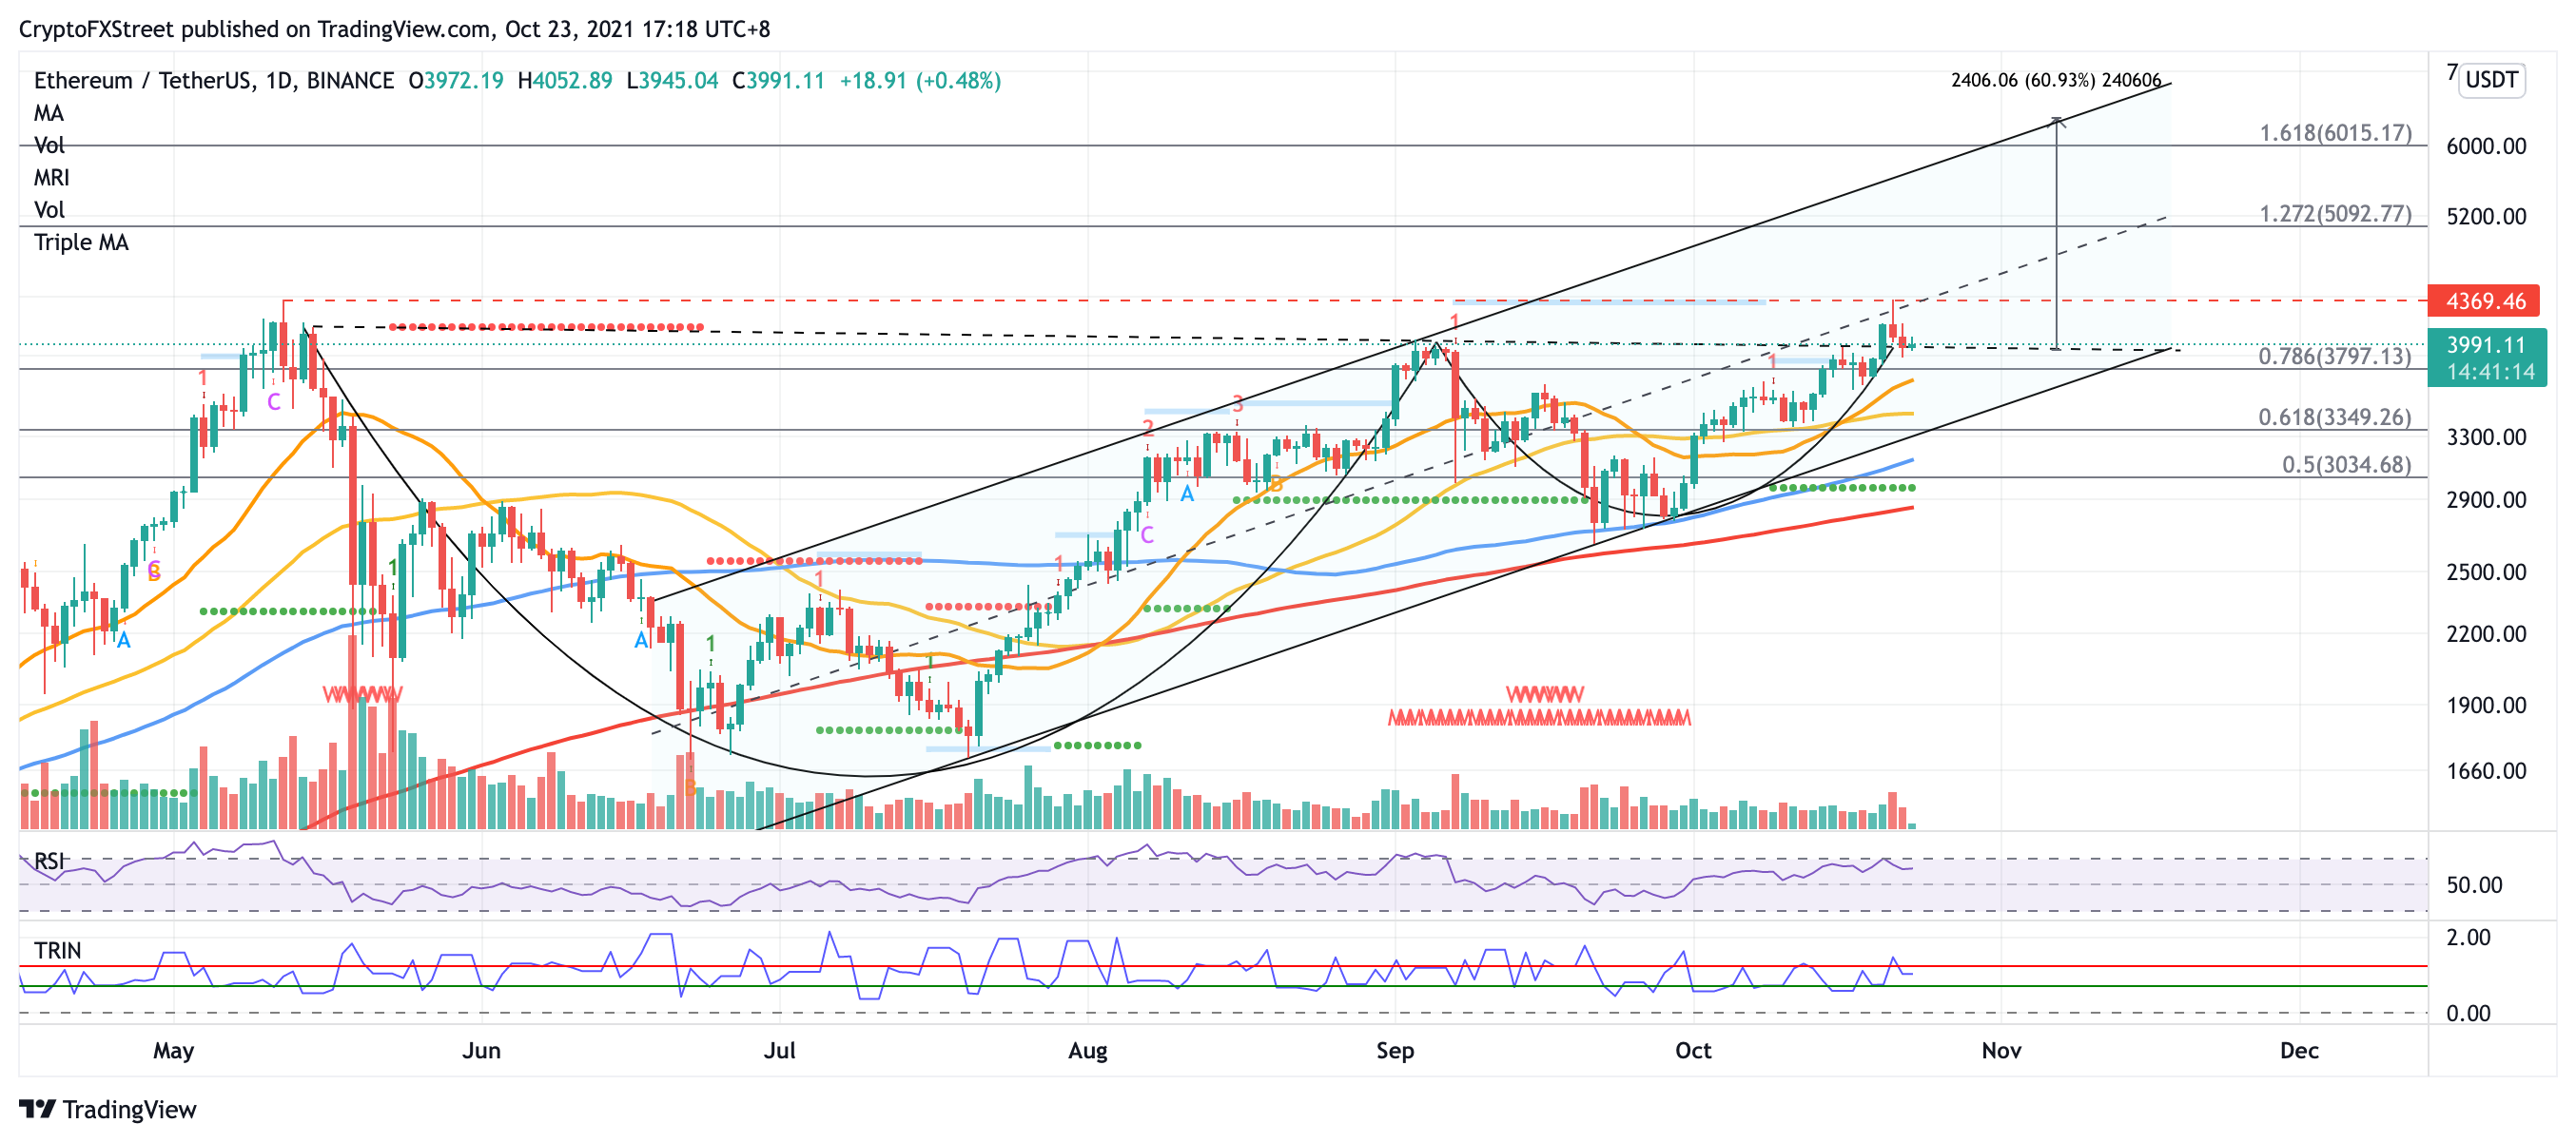
ETH/USDT daily chart
Ethereum price will discover immediate support at the support trend line at $3,960, then at the 78.6% Fibonacci retracement level at $3,797. The following line of defense will emerge at the 21-day Simple Moving Average (SMA) at $3,710, then at the 50-day SMA at $3,453 before eventually dropping toward the lower boundary of the ascending parallel channel at $3,349, which meets the 61.8% Fibonacci retracement level.
If Ethereum price fails to hold above the aforementioned levels of support, the bullish outlook may be voided, prompting ETH to plunge lower toward the 100-day SMA at $3,137.
ETH bulls should aim for a daily close above $3,960 to reinforce commitment for the bullish target to be on the horizon.
Author

Sarah Tran
Independent Analyst
Sarah has closely followed the growth of blockchain technology and its adoption since 2016.


