Ethereum price flashes multiple sell signs after setting up fresh highs
- Ethereum price looks at a steep decline after setting up a new all-time high at $2,800.
- Multiple technical, social and on-chain indicators suggest a short-term sell-off is near.
- A sustained buying pressure leading to a higher high above $2,800 would invalidate the bearish thesis.

Ethereum price has been on a tear after the recent market crashes. While the pioneer cryptocurrency moves sideways, ETH has shattered its ceiling and set up new all-time highs. However, this drastic increase in its market value could lead to a minor pullback.
Ethereum price eyes correction
On the 12-hour chart, Ethereum price shows two crucial technical formations that suggest a bearish outlook, the spinning top candle and the Momentum Reversal Indicator’s (MRI) cycle top signal.
Both these signs are indicative of bullish exhaustion, which often leads to a correction.
A bearish spinning top candlestick is a technical formation that contains long wicks and a short body that closes below its opening price. This pattern is formed at the top of an upswing and forecasts a reversal.
Adding credence to this bearish outlook is the MRI’s cycle top flashed in the form of a red ‘one’ candlestick. Such a setup projects that a one-to-four candlestick correction could ensue.
The stable support barrier at $2,546.8 is the first line of defense for this sell-off. A breach of this would allow the bears to target the 50 Simple Moving Average (SMA) on the 12-hour chart that coincides with another crucial demand level at $2,312.3.
The horizontal trend lines at $2,371.2 and $2,253.4 act as a buffer zone, present above and below the said target. Here ETH bulls could potentially rescue the smart contract token and kick-start an upswing.
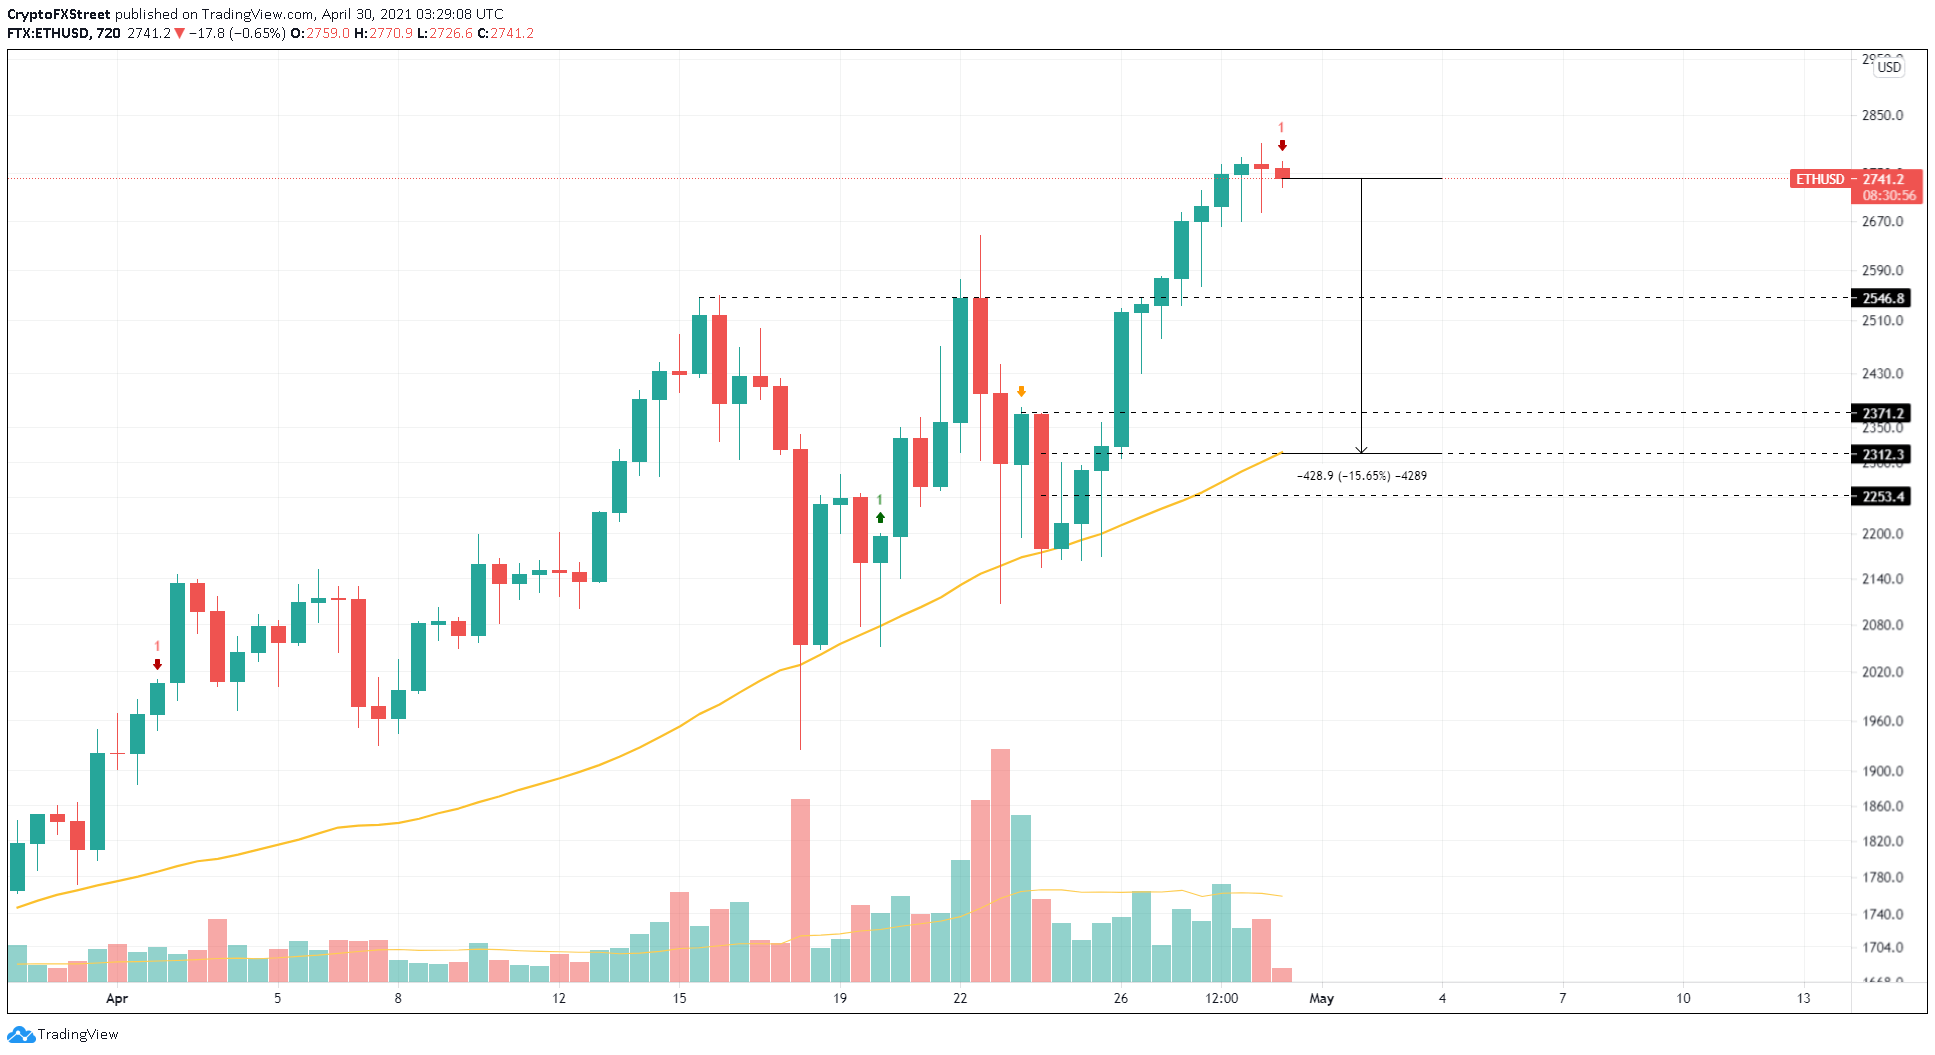
ETH/USD 12-hour chart
An increase in the number of daily active addresses interacting with the Ethereum blockchain is bullish and can be considered as a proxy of investor interest in ETH at the current price levels. However, the contrary of it also holds true.
At press time, not only is ETH price increasing, but the number of daily addresses has dropped 7.1% from 700,000 to 650,000 since April 21, portraying a bearish divergence and suggesting that a decline in price might follow.
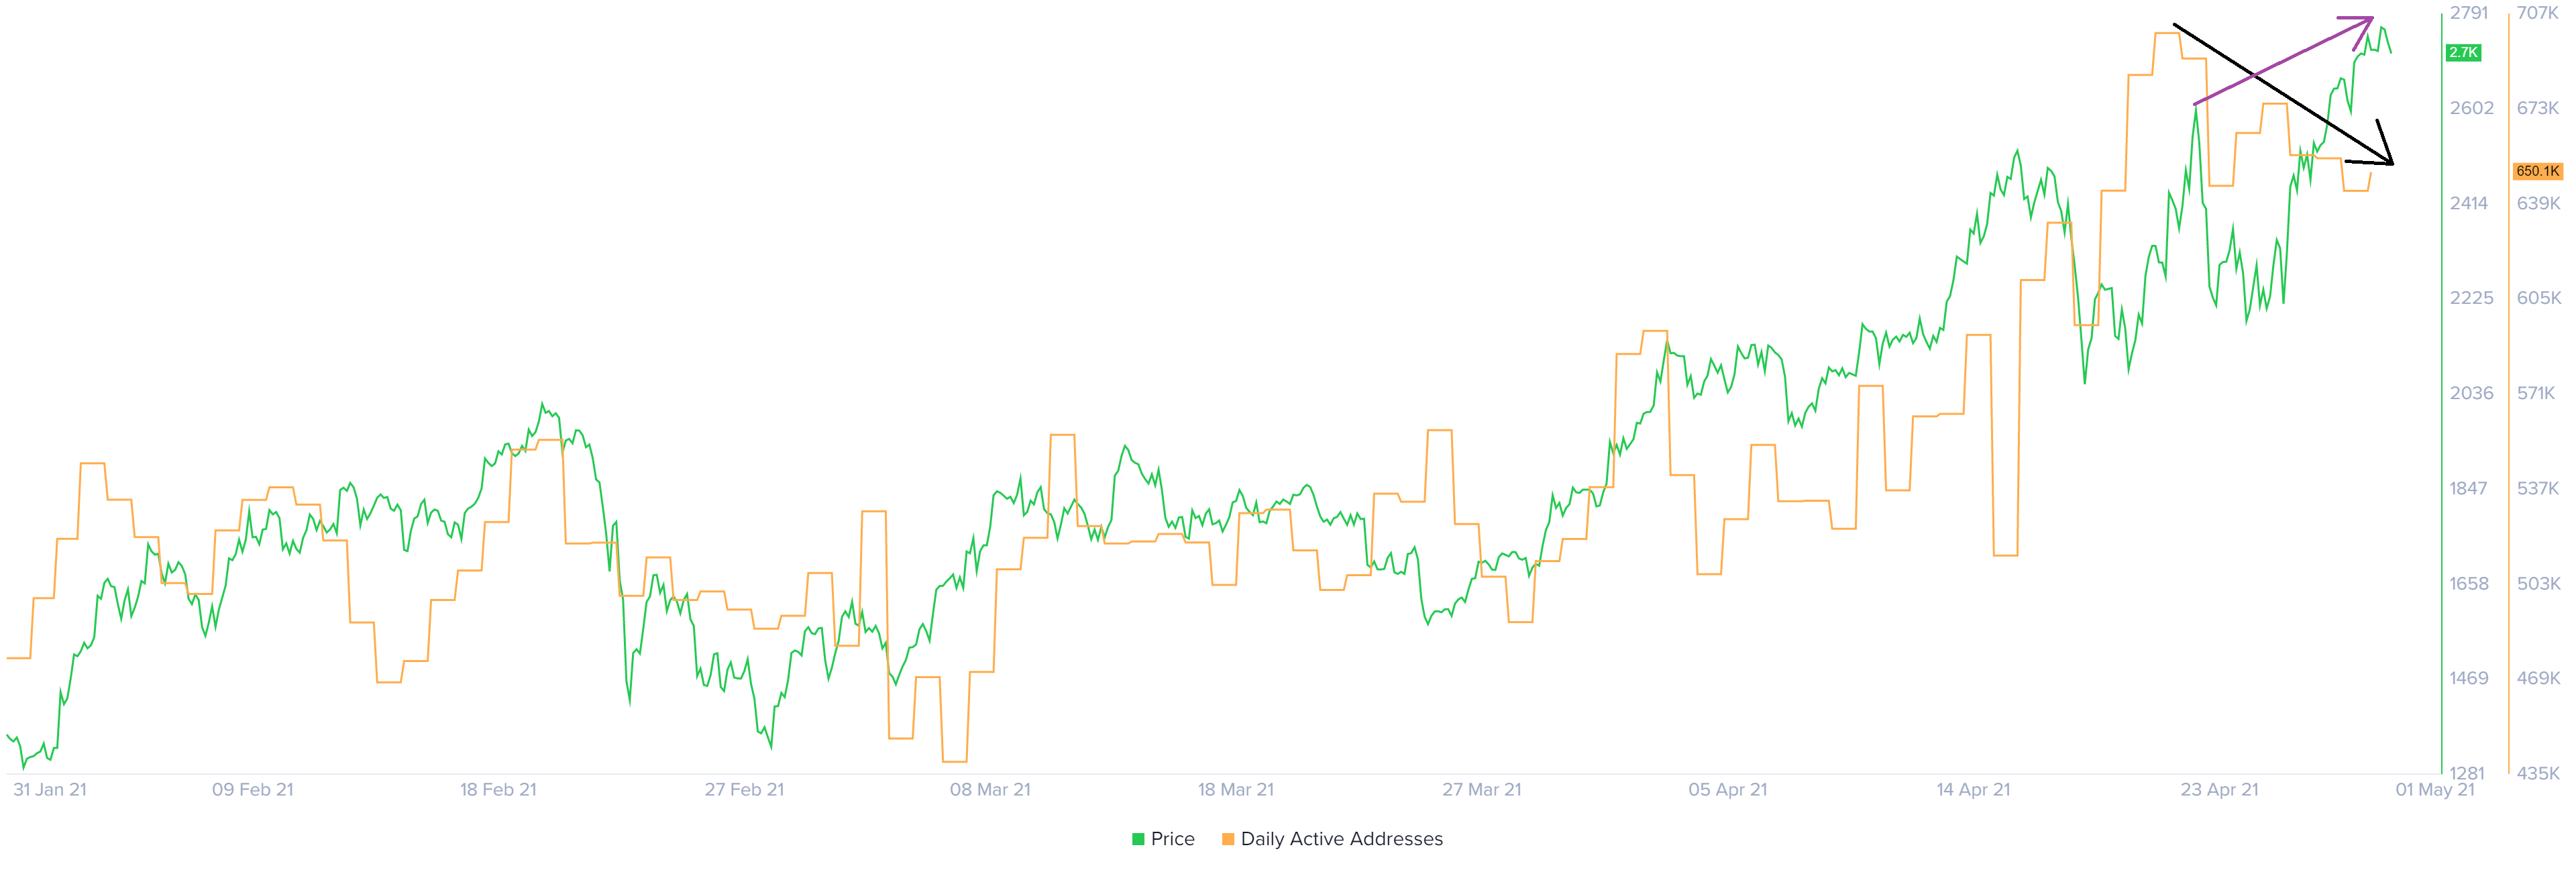
ETH price and daily active addresses chart
Adding headwind to ETH buyers is Santiment’s 30-day MVRV model, which shows that 19.3% of the investors who purchased Ether in the past month are experiencing profits.
A similar bump in MVRV was seen in early April, which eventually led to a decline as market participants rushed to book profits.
History reveals that a spike in social volume usually occurs at price tops. Therefore, the recent 61% bump in this metric is bearish from a counter-sentiment perspective and adds credence to the correction thesis mentioned above.
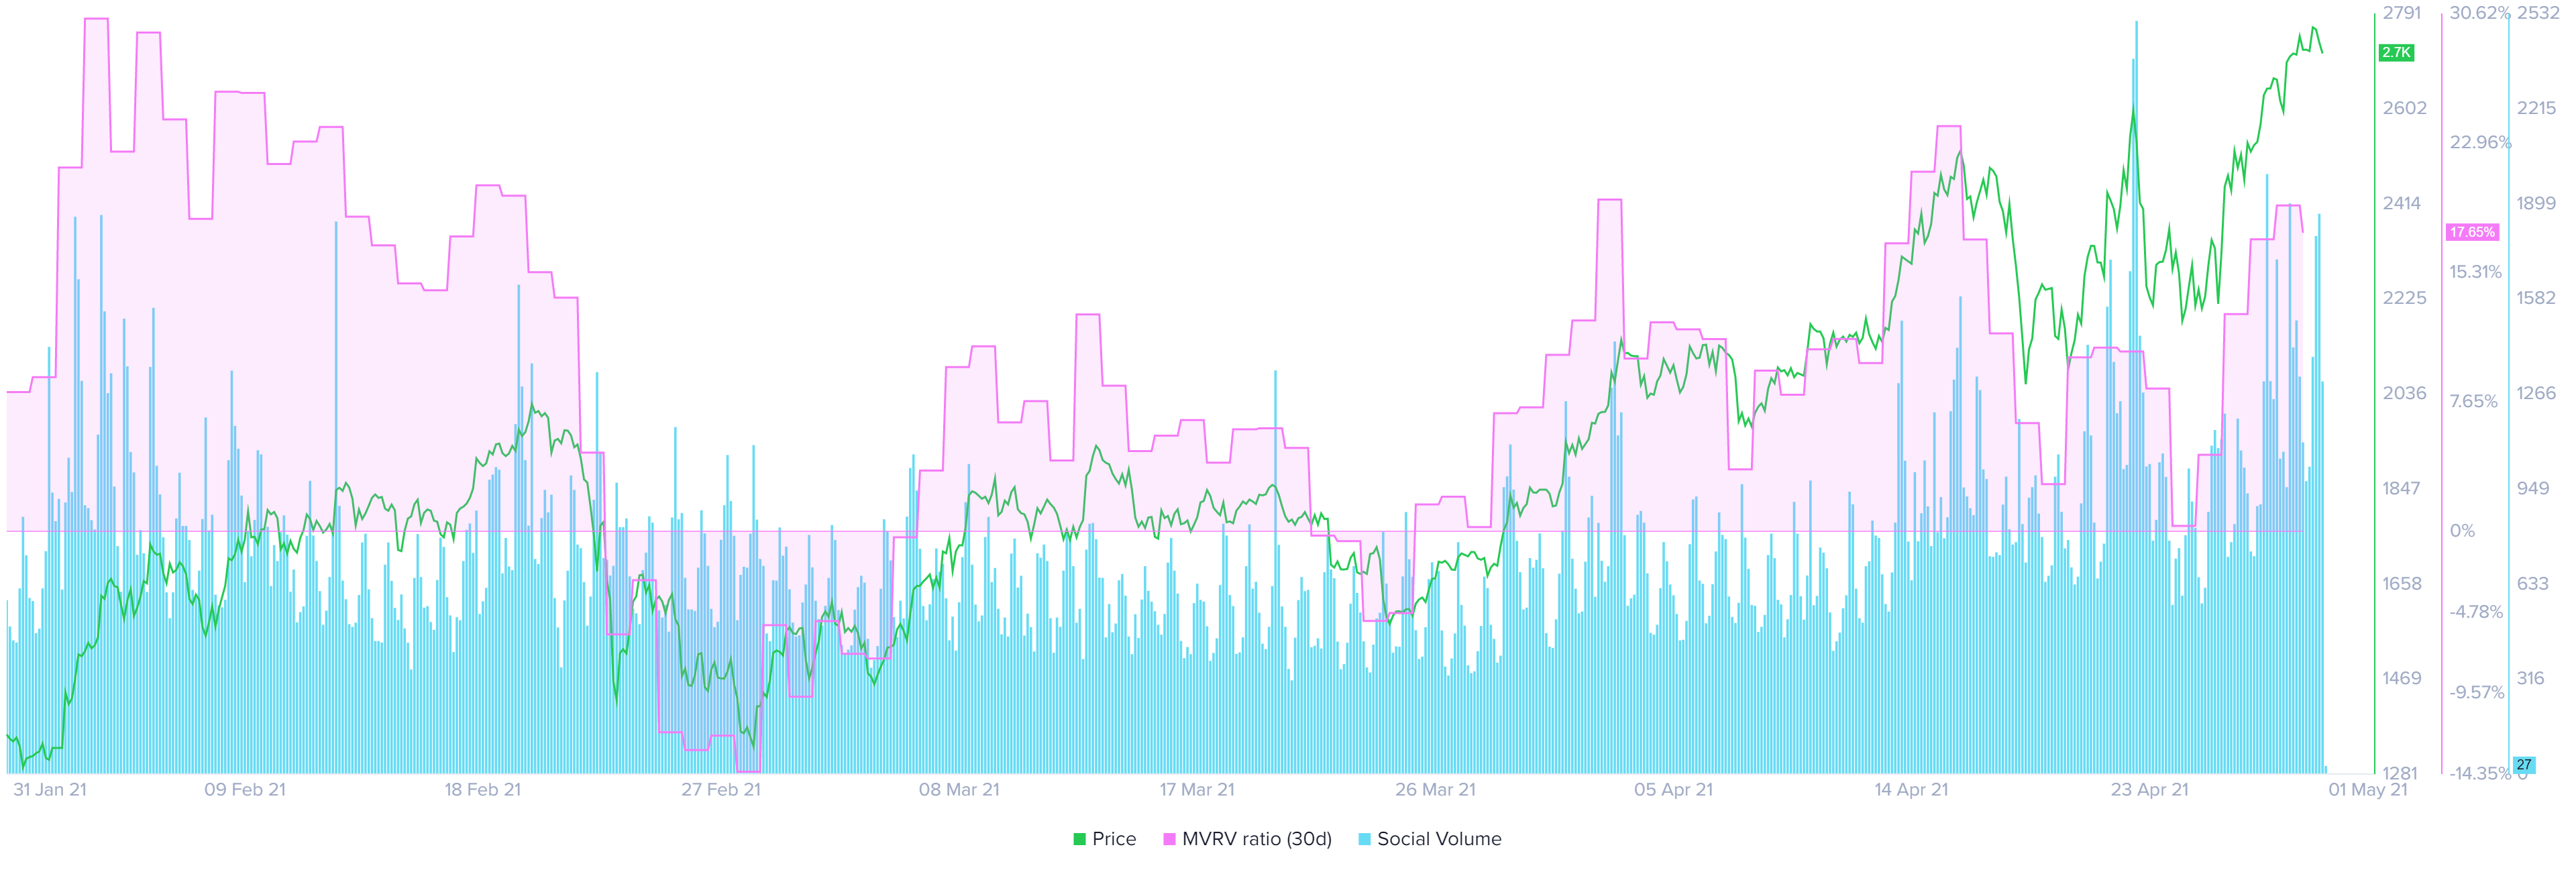
ETH 30-day MVRV and social volume chart
The only arsenal in the buyers’ corner is the diminishing supply of ETH held on exchanges. This value has dropped 16.3 million to 13.7 million since the beginning of 2021. Such a sharp collapse causes a negative supply shock and could potentially increase Ethereum price.
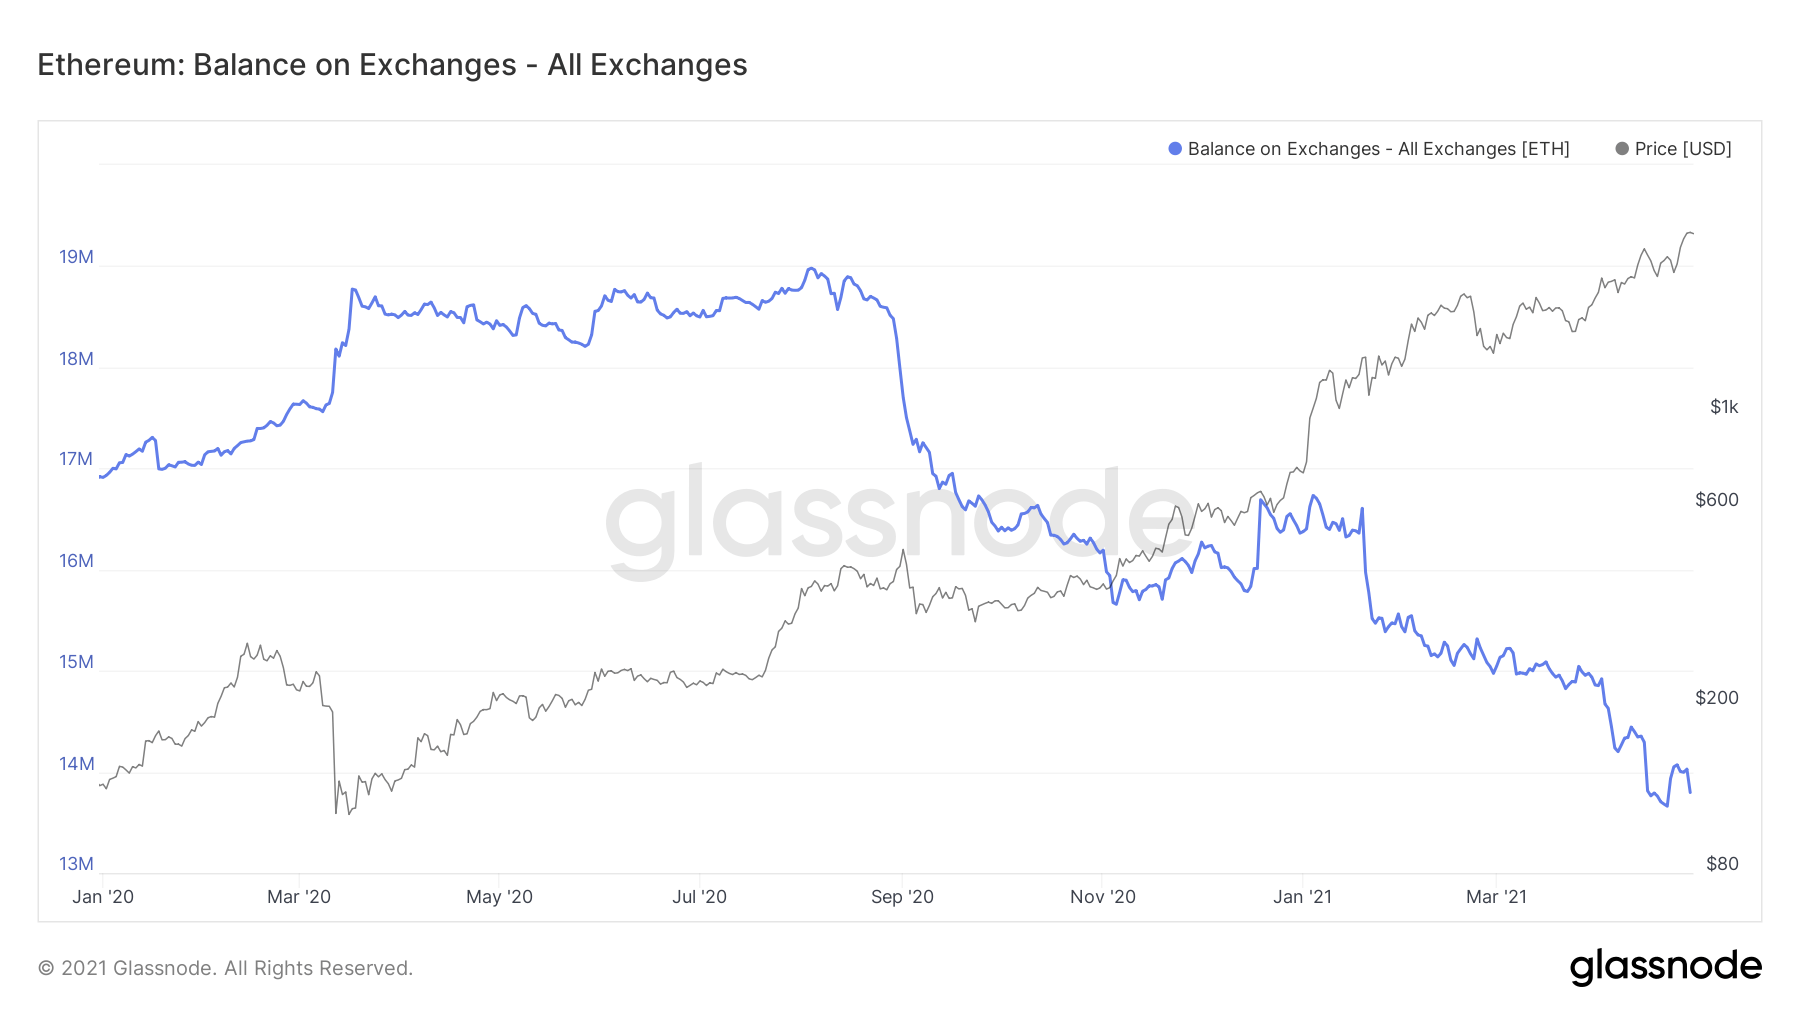
ETH held on exchanges chart
While everything seems to be bearish for the second-largest cryptocurrency (by market cap) in the world, investors should consider the possibility of ETH price defying technical and on-chain indications due to the current bull run.
If Ethereum price creates a higher high above $2,810, it will invalidate the bearish scenario and kick-start a bullish one.
In such a case, market participants can expect the pioneer altcoin to surge to $2,842.
Author

Akash Girimath
FXStreet
Akash Girimath is a Mechanical Engineer interested in the chaos of the financial markets. Trying to make sense of this convoluted yet fascinating space, he switched his engineering job to become a crypto reporter and analyst.


