Ethereum price presses higher while ETH technology used by EIB for digital notes
- Ethereum price scales the wall of worry to guide cryptocurrency market higher.
- Weekly Relative Strength Index (RSI) begins flashing bearish momentum divergence.
- European Investment Bank (EIB) issues $121 million in two-year digital notes.

Ethereum price presses higher after convincingly holding the critical February high during the correction this month. The bullish outlook remains in place with the psychologically important $3,000 in the crosshairs.
Ethereum price outperformance buoyed by liquidity and turnover
With Goldman Sachs, Banco Santander SA, and Societe Generale AG serving as joint managers, the European Investment Bank, the lending arm of the European Union, issued two-year digital notes using Ethereum technology yesterday.
According to the EIB, the transaction is a series of bond tokens on a blockchain, where a range of investors can buy and pay for the tokens using fiat currency. The digital notes have a zero-coupon and are registered on the Ethereum blockchain.
Adoption of the Ethereum blockchain is just one of the catalysts behind the notable relative strength for ETH price in April. Still, a JP Morgan research note argues that the smart contracts giant has also witnessed improvements in liquidity and higher turnover.
The bank and asset manager highlighted that “ETH spot depth has recovered quicker and if anything conditions on some exchanges is better than prior to the event.” Moreover, higher turnover has minimized the impact of liquidations.
Higher turnover on the ETH public blockchain means a noticeably higher fraction of those tokens can be considered highly liquid, further blunting the impacts of futures liquidations.
Institutional adoption and ETH demand for diversification purposes elevate the digital token into a credible alternative to Bitcoin, and the retail investor ranks shouldn’t underestimate it.
Ethereum price has now surpassed the resistance of the 161.8% Fibonacci extension of the February crash at $2,504. It is charging towards the critical $3,000 level, voiding the bearish alternative mentioned in an April 25 FXStreet article about a potential head-and-shoulders top pattern.
Price targets are $3,000, the 161.8% extension of the April decline at $3,020, and then the cluster of 261.8% Fibonacci extensions related to the 2018 bear market, the February decline, and the April decline, beginning at $3,252 and extending to $3,626.
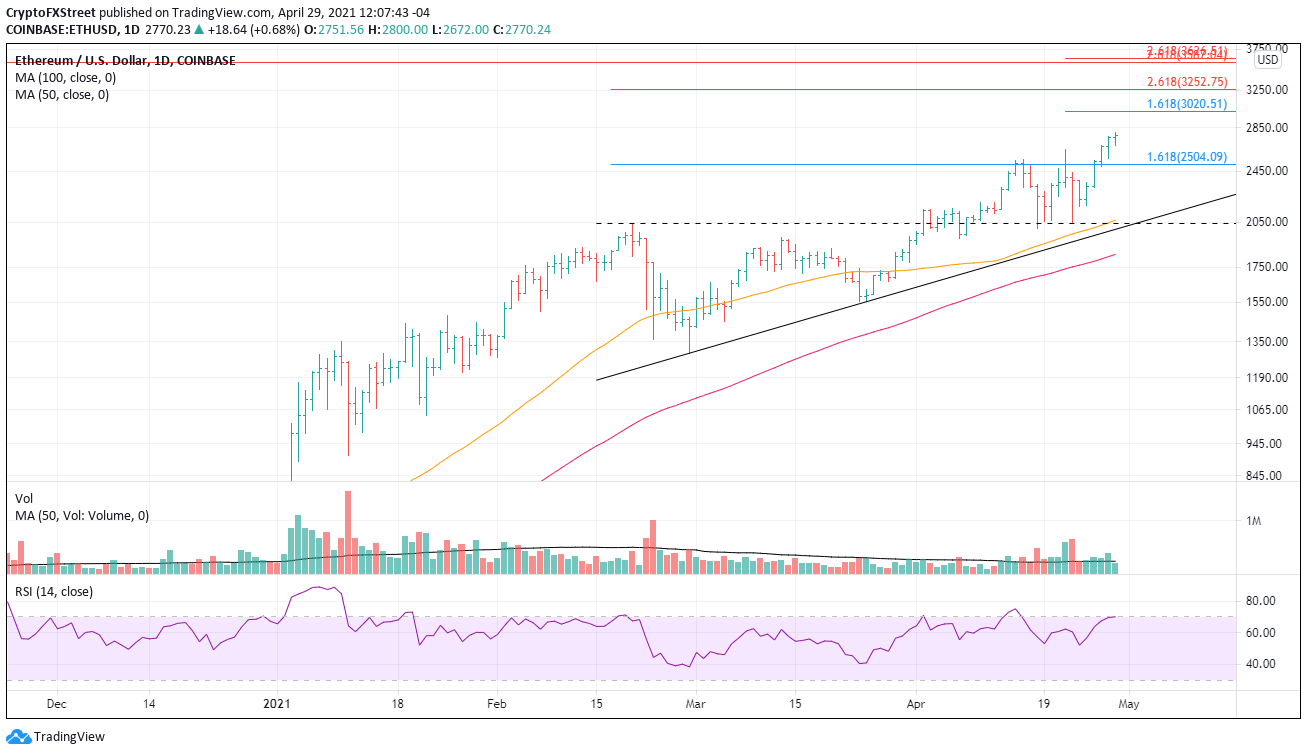
ETH/USD daily chart
As mentioned above, the bearish alternative has been discarded. Therefore, as long as ETH holds the 161.8% extension at $2,504 on a daily closing basis, the upward path should continue over the medium term.
Author

Sheldon McIntyre, CMT
Independent Analyst
Sheldon has 24 years of investment experience holding various positions in companies based in the United States and Chile. His core competencies include BRIC and G-10 equity markets, swing and position trading and technical analysis.



