Ethereum Price Analysis: ETH on the brink of 23% technical breakout
- Ethereum is in the initial stages of a colossal inverted H&S pattern breakout.
- The IOMAP reveals the absence of robust resistance, validating the expected upswing.
- Failing to hold above the inverted H&S pattern will pave the way for losses toward $1,600.

Ethereum managed to come out of last week's woods by overcoming the stubborn resistance at $1,600 during the weekend session. The flagship smart contract token extended the action above $1,700, but the uptrend stalled short of $1,800. At the time of writing, Ether is trading around $1,750 following a key technical breakout.
Ethereum upswing eyes $2,000
Ethereum's most recent recovery completed the formation of an inverted head-and-shoulders (H&S). The pattern is usually bullish and results in a price breakout target above the neckline. Ether has already commenced the breakout but faces some resistance toward $1,800. Retesting the neckline support could jumpstart the upswing, paving the way for gains above $1,800.
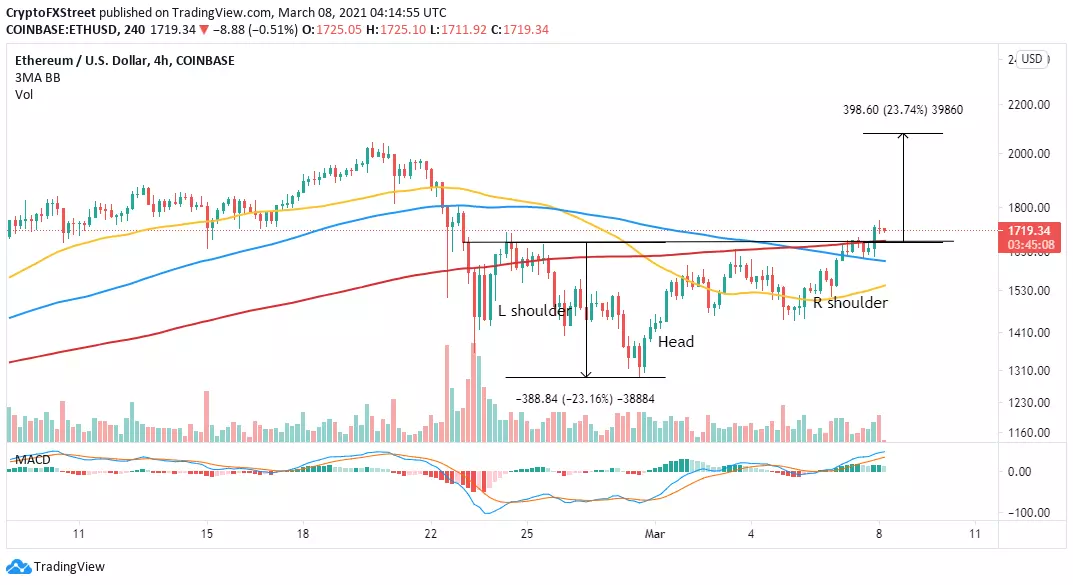
ETH/USD 4-hour chart
The bullish outlook is validated by the Moving Average Convergence Divergence (MACD). A MACD line cross above the signal line added credibility to the upswing. As long as the trend momentum indicator remains stable while moving north, Ethereum would come closer to achieving the target above $2,000.
IntoTheBlock's IOMAP model reveals that Ethereum has been a relatively smooth path toward $2,000. The lack of a formidable resistance could hasten the above-mentioned technical breakout. However, the model directs our attention to a subtle seller congestion zone between $1,890 and $1,932. Here, around 314,400 addresses previously bought roughly 968,000 ETH.
On the downside, Ether is sitting on an area with immense support, confirming that the least resistance path is upwards. The support running from $1,513 and $1,565 has been highlighted by the approximately 329 addresses currently profiting from the 11 million ETH bought within the range.
-637507762971498932.png)
Ethereum IOMAP chart
Looking at the other side of the fence
Ethereum's uptrend has stalled before hitting $1,800 despite the H&S breakout. There's a need to secure high support, preferably at the pattern's neckline. Failing to close the day above this zone may lead to a breakdown toward the 100 Simple Moving Average (SMA) at $1,600 on the 4-hour chart.
Author

John Isige
FXStreet
John Isige is a seasoned cryptocurrency journalist and markets analyst committed to delivering high-quality, actionable insights tailored to traders, investors, and crypto enthusiasts. He enjoys deep dives into emerging Web3 tren


