Ethereum market overview: ETH/USD forms flag pattern; what next?
- The formation of the bull flag pattern could see a significant reversal above $270 in the short-term.
- Ethereum must defend the flag pattern support to avoid declines that are likely to retest $240.

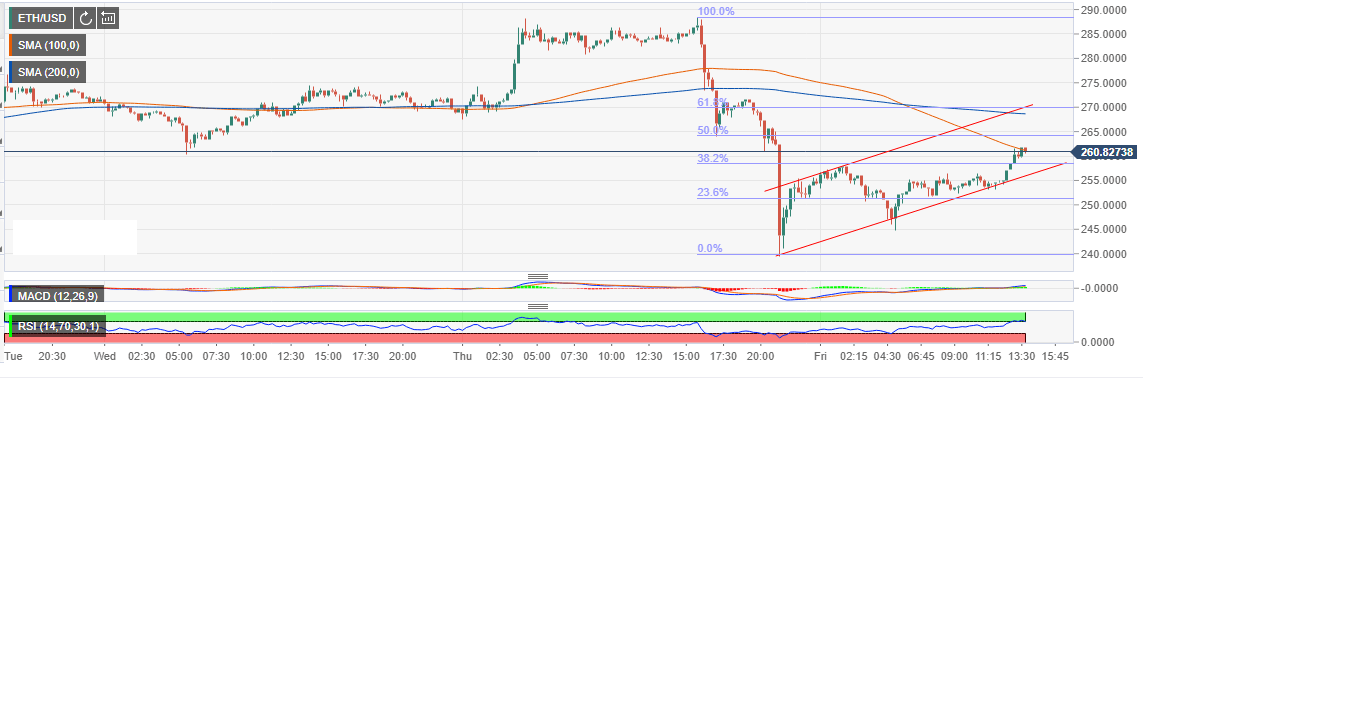
Ethereum held on to the support at $240 in the most recent declines. Prior to the fall, ETH/USD had corrected above $285 resistance. The crypto extended the gains above towards $290 but a reversal occurred at $288.47.
Increasing bearish pressure pushed the price below the 100 Simple Moving Average (SMA) and the 50 SMA 15-minutes. The price plunged further below the 61.8% Fib retracement level between the last swing high at $288.47 and a swing low at $240.
Various support levels gave in to selling pressure including the range support at $260 - $262 and $250. Extended declines swung below $245 but the bulls found bearing at $240 allowing for reversal. Meanwhile, the recovery above $260 has stalled short of the 50% retracement level resistance.
The formation of the bull flag pattern could see a significant reversal above $270 in the short-term. However, the buyers must defend the flag pattern support to avoid declines that are likely to retest $240 and breakdown further to $230 support. Technically, Ethereum is in a bullish zone and could trend upwards in the remaining sessions on Friday.
Author

John Isige
FXStreet
John Isige is a seasoned cryptocurrency journalist and markets analyst committed to delivering high-quality, actionable insights tailored to traders, investors, and crypto enthusiasts. He enjoys deep dives into emerging Web3 tren


