Ethereum fees skyrocket as NFT market witnessed explosive growth in the first week of 2022
- Ethereum fees are soaring in tandem with the tremendous growth of NFTs in the first week of 2022.
- NFT projects on the ETH network have reached almost 250,000 transactions.
- A technical indicator suggests that ETH bulls are planning to reverse the period of sluggish performance.

The popularity of non-fungible tokens (NFTs) continues to soar after tremendous growth last year. Leading NFT marketplace recorded over $243 million worth of Ethereum trading volume on January 2, a steep increase from $170 million the day prior. Despite the recent price dip, ETH fees have reached a one-month high.
Ethereum fees reach one-month high
The Ethereum total fees paid metric has reached a one-month high, according to data by Glassnode. ETH fees paid in the market reached the highest point on January 9 at $1,882,360.
The soaring Ethereum fees increased in tandem with the rising popularity of NFTs. According to CoinMetrics, the activity of NFT projects on the ETH network has displayed a strong start in the new year with nearly 250,000 transactions.
Within the first month, the daily transactions record has surpassed last year’s daily transaction record of 240,000 reached in September.
On January 2, OpenSea recorded more than $243 million worth of Ethereum trading volume, a significant increase from $124 million two days prior.
Currently, Ethereum is the leading platform for NFT artwork and collectibles, with over 90% NFT volume based on the network in 2021.
Ethereum price makes first attempt at recovery
Ethereum price appears to be searching for a reliable foothold as the bulls plan a recovery. The Momentum Reversal Indicator (MRI) has flashed a bottom signal, suggesting that a reversal may be in the offing.
On December 28, Ethereum price sliced below the symmetrical triangle pattern, indicating a bearish forecast with a 25% drop. ETH has nearly reached the pessimistic target, but appears to have discovered a line of defense at the January 8 low at $3,005.
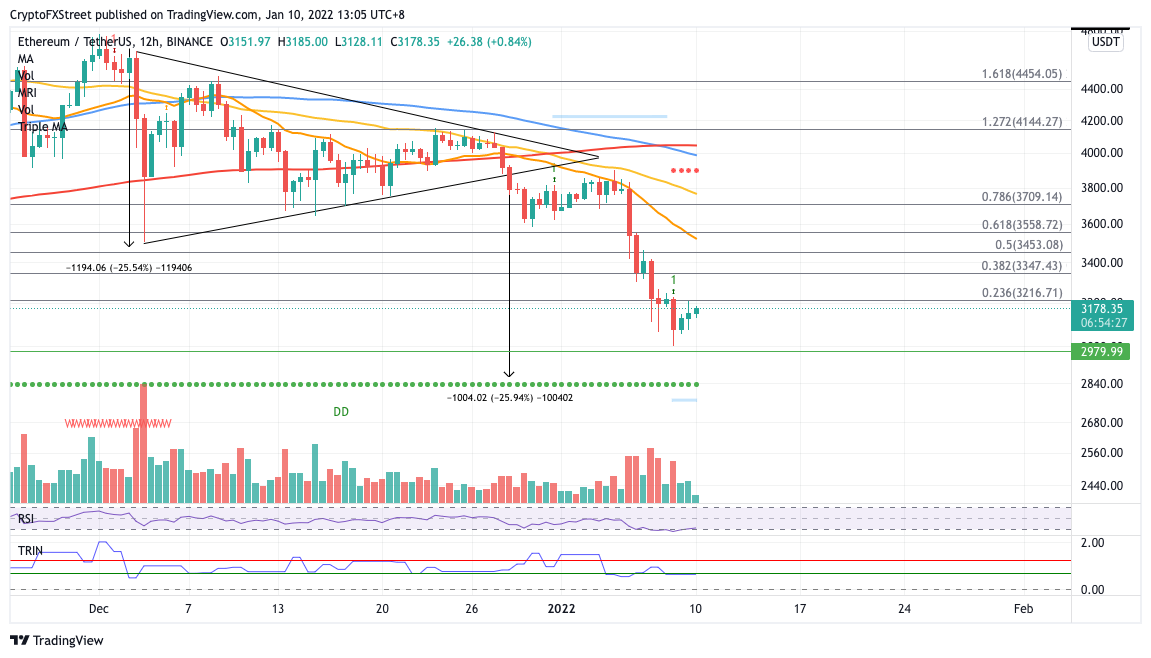
ETH/USDT 12-hour chart
The first area of resistance for Ethereum price is at the 23.6% Fibonacci retracement level at $3,216, then at the 38.2% Fibonacci retracement level at $3,347. Bigger aspirations will target the 50% retracement level at $3,453.
However, if the bears continue to take control, Ethereum price may slide toward the September 24 high at $2,979.
Author

Sarah Tran
Independent Analyst
Sarah has closely followed the growth of blockchain technology and its adoption since 2016.


