Ethereum ended the week 13% lower but ETH bulls are ready to take over
- Ethereum price has been down 21% over the past two weeks.
- A key drop below a bullish continuation pattern (bull flag) generated new short positions.
- Oscillator values support a significant bounce and rejection of any further selling pressure.

Ethereum price has created conditions where many short sellers have dived into pushing ETH lower. Bears are convinced of a new bear market. However, they may have just played right into the hands of the bulls.
Ethereum price ready to begin a short squeeze that could rally Ethereum to new all-time highs
Ethereum's collapse to close the weekly chart by double-digit percentage losses ended near a major support zone. The 38.2% Fibonacci retracement, weekly Kijun-Sen, and a high volume node in the volume profile share the $3,100 to $3,350 value area.
The most essential technical information in the daily weekly Ichimoku chart is the discrepancy between the candlestick swing structure and the Composite Index. Ethereum price has a series of higher lows while the Composite Index has lower lows – in fact, the Composite Index just hit a low not seen since September 2019. That behavior has created hidden bullish divergence.
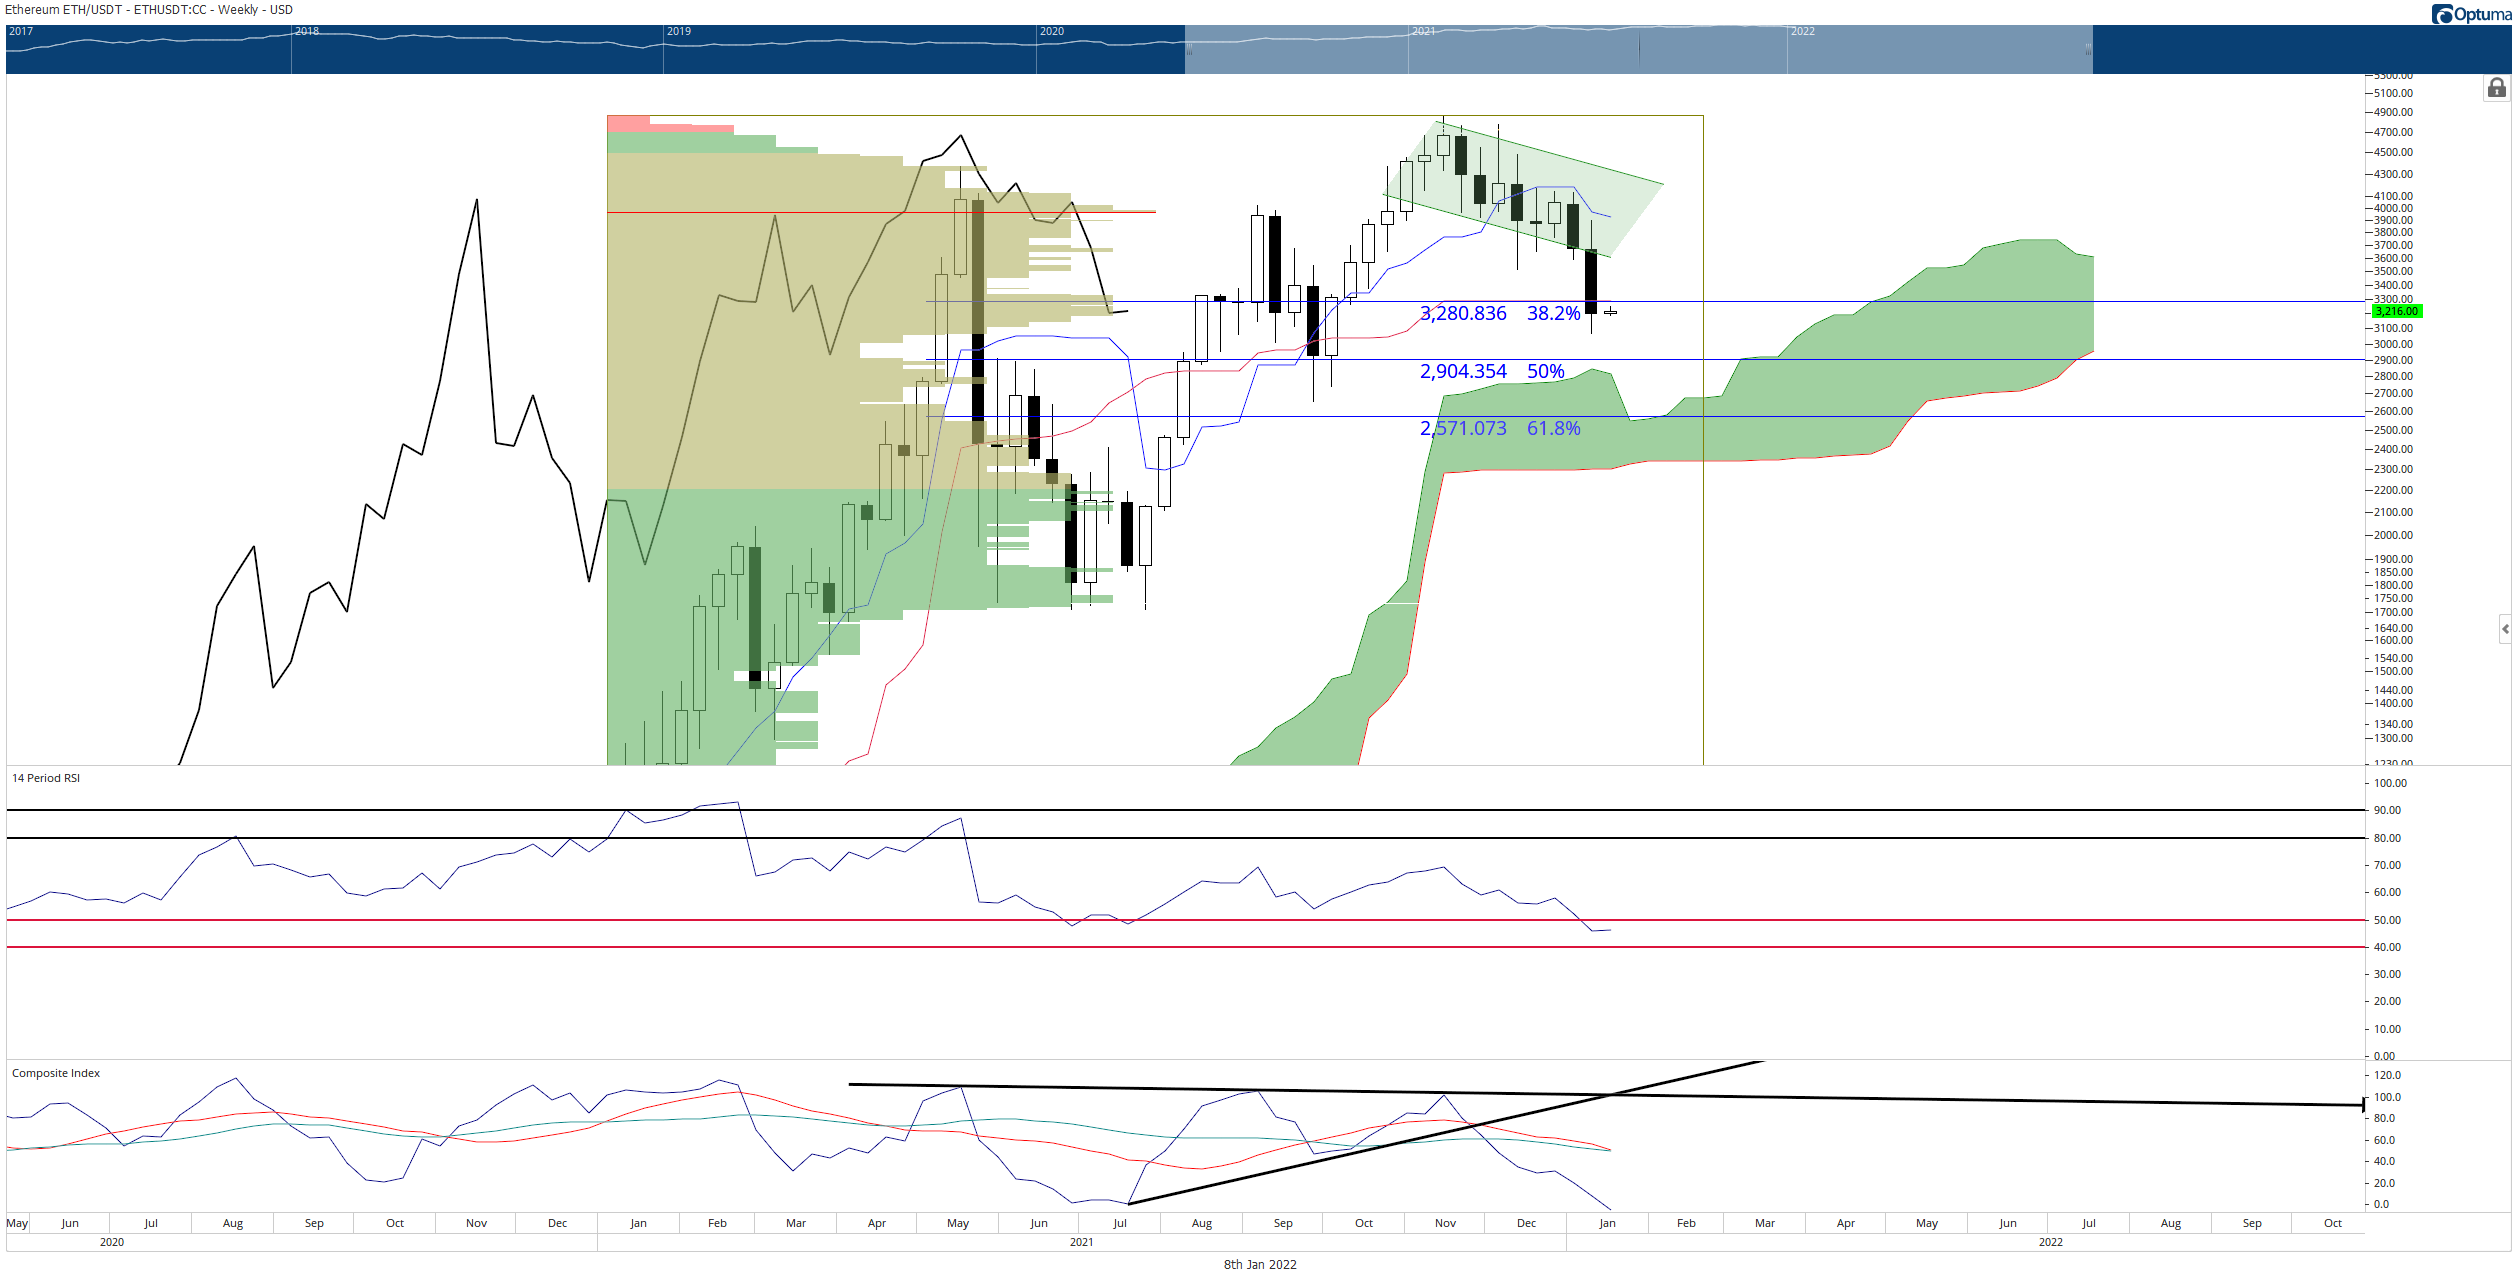
ETH/USD Weekly Ichimoku Chart
Hidden bullish divergence is a warning that the current corrective move is about to end and that a resumption of the uptrend is likely to continue soon. As a result, a trade opportunity is now present on the Point and Figure chart.
There is a theoretical long entry for Ethereum on its $100/3-box reversal Point and Figure chart. The long setup is a buy stop order at $3,500, a stop loss at $3,100, and a profit target at $5,500. The theoretical long trade is a 5:1 reward/risk setup with a projected profit target of over 60% from the entry. A three-box trailing stop would help protect any profit generated after hitting the entry.
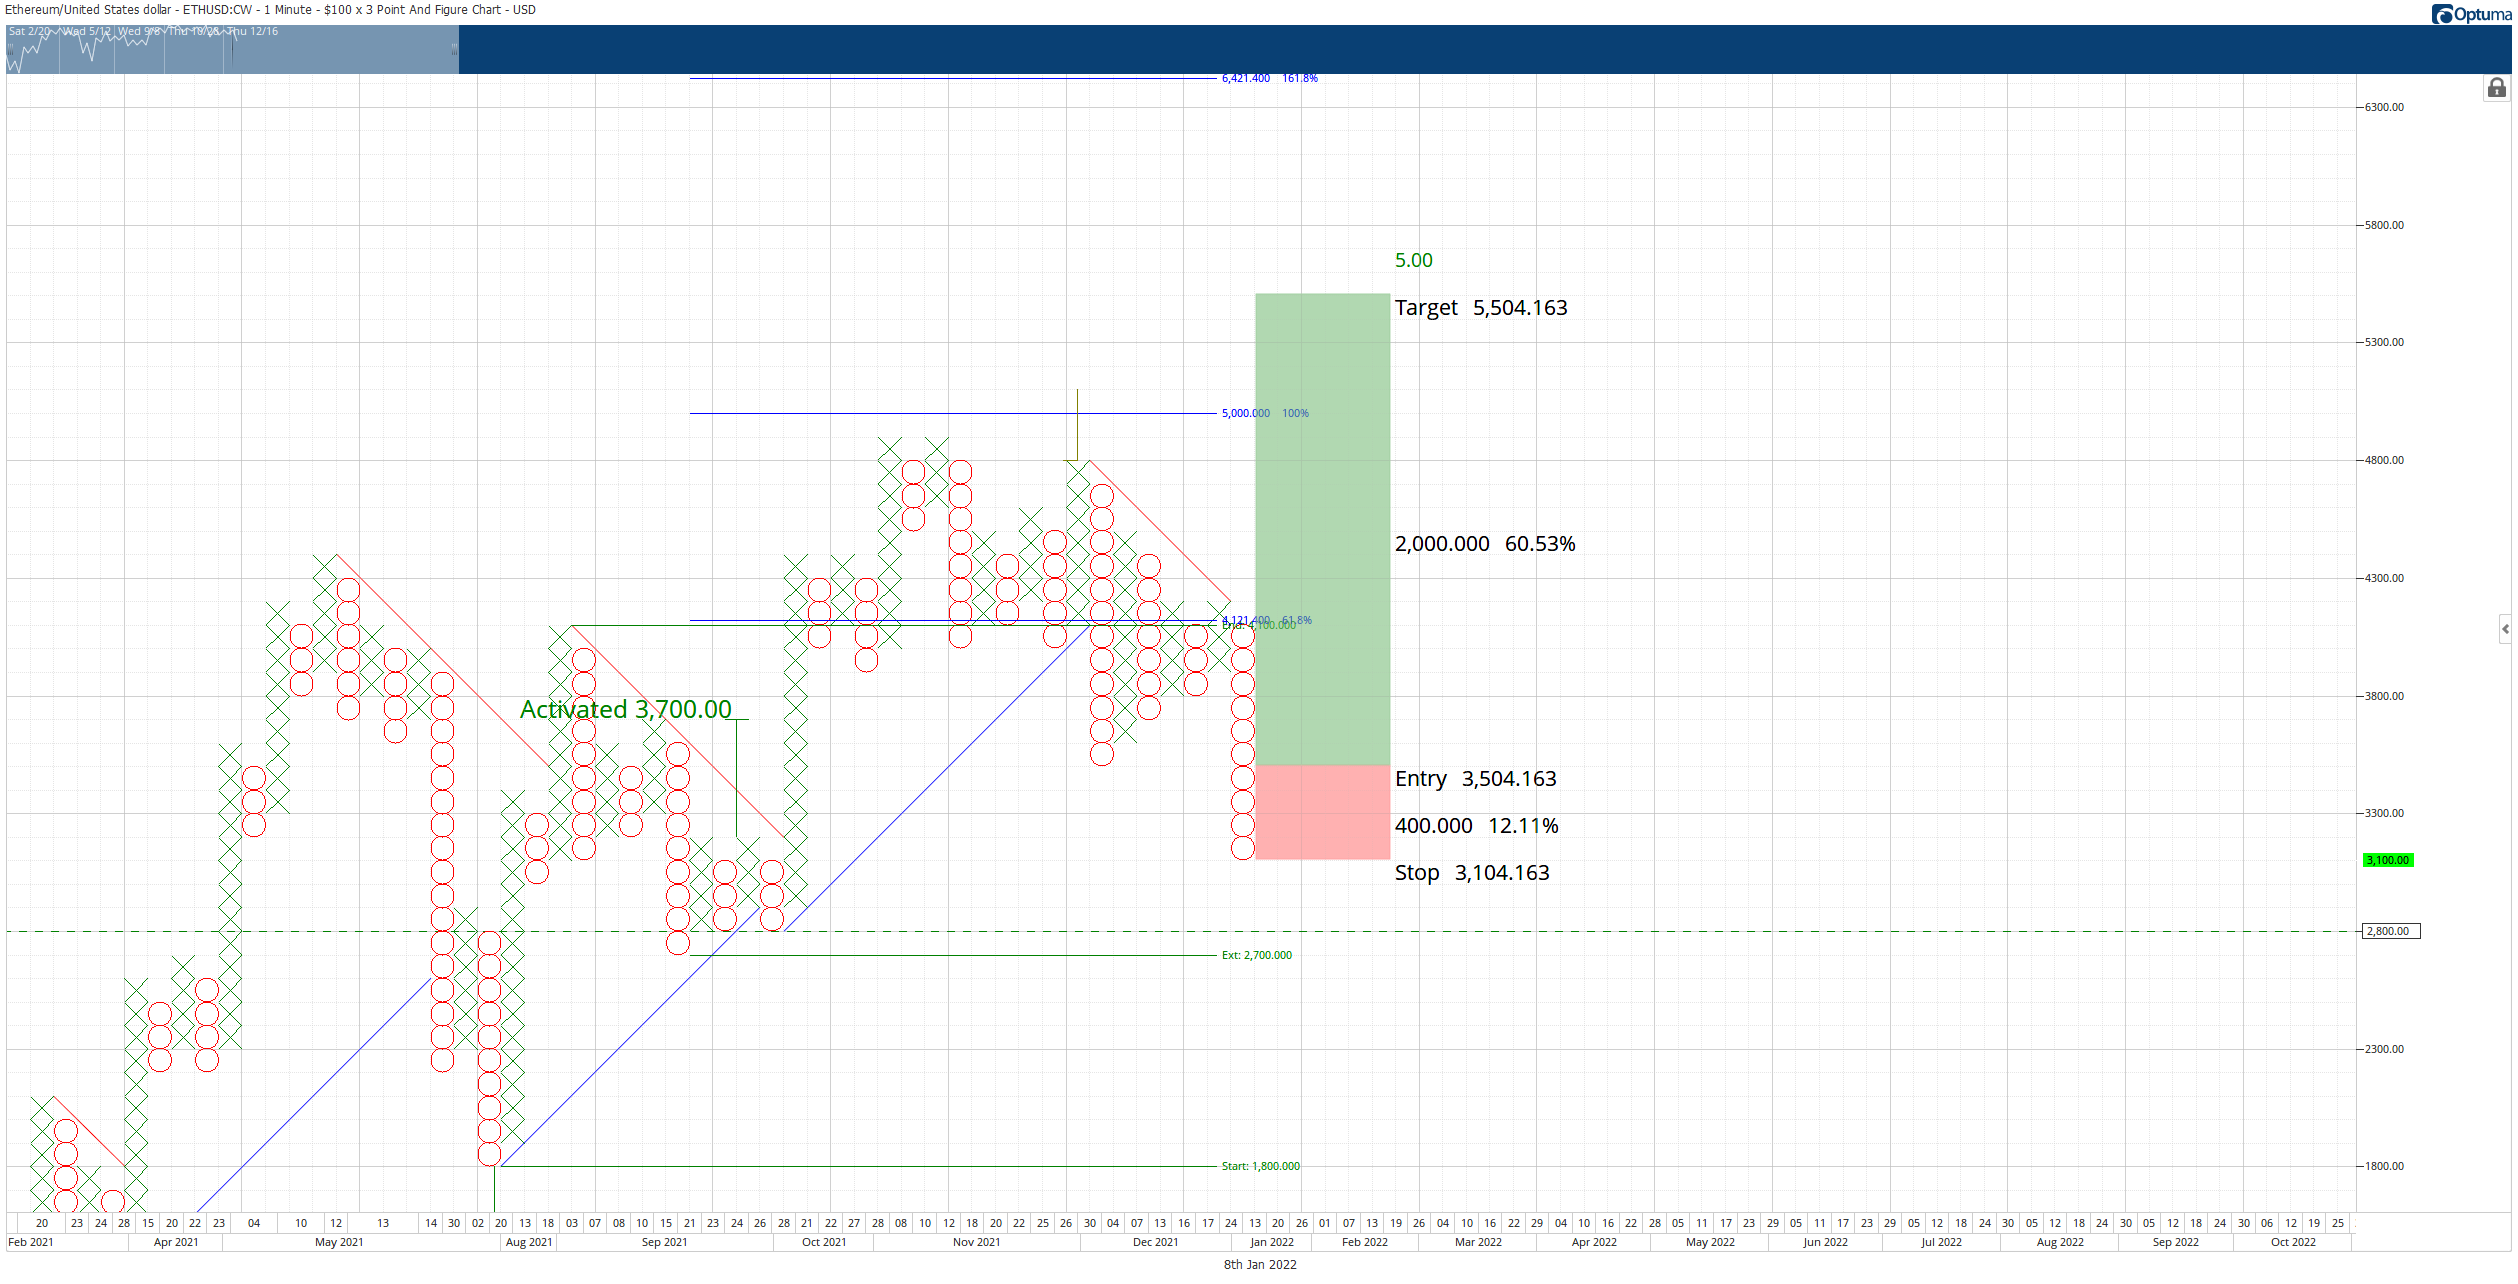
ETH/USD $100/3-box Reversal Point and Figure Chart
There is no invalidation point for Ethereum price within its theoretical long setup. If Ethereum moves lower, the buy stop and stop loss move with the lower price action, but the profit target remains the same.
Author

Jonathan Morgan
Independent Analyst
Jonathan has been working as an Independent future, forex, and cryptocurrency trader and analyst for 8 years. He also has been writing for the past 5 years.


