Ethereum Classic Price Forecast: ETC sets sights on new buying opportunity
- Ethereum Classic price finds support at the 2018 high, but not after a 75% decline.
- ETC on pace for the second-largest two-week decline since November 2018.
- The massive Ethereum proxy rally is erased in a matter of days.

Ethereum Classic price was down 55% today at the intra-day low of $40 and a stunning 75% from the May 6 high of $158.76. The short-term outlook is cloudy for ETC, with several technical challenges to confront, but a new opportunity might be on the horizon for tactical investors.
Ethereum Classic price erases billions in market capitalization
As of May 15, Ethereum Classic price quietly designed an inverse head-and-shoulders pattern on the 4-hour chart that projected a continuation of the rally beyond the May 6 high at $158.76. The emerging selling pressure unfolding in the cryptocurrency complex seized control of ETC and pushed it lower, culminating with today’s crash.
Over the last two weeks, Ethereum Classic price has declined over 45% on a closing basis, listing it as the second-largest two-week decline since 2016, and the week is not over yet. A 47% decline only exceeded it in November 2018.
It is a devastating follow-up to the 1200% advance over six weeks that began with the breakout from a symmetrical triangle at the beginning of April and ended just short of the 361.8 Fibonacci extension of the 2018 decline at $161.33.
The ongoing decline did not find any support at the key Fibonacci retracement levels of the preceding advance until the 78.6% retracement level at $43.18, which loosely correlates with the 10-week simple moving average at $44.83 and the 2018 high at $46.98.
On the 12-hour chart, Ethereum price is working on a bullish hammer candlestick pattern that would provide short-term orientated investors a tactical entry point. The ETC 4-hour chart has already defined a hammer candlestick, but a larger timeframe gives more decisive confirmation. The hammer demonstrates that buyers finally overwhelmed sellers and drove prices up aggressively.
Starting tomorrow, ETC will need to trade above the hammer high at $72.77 to trigger the new buy signal. The hammer is confirmed with a rally above the preceding candlestick high at $90.00. It is encouraged for those readying to take the trade on the trigger, to begin with pilot buys and gradually ease into the trade as Ethereum Classic price proves itself. Moreover, they should be prepared for bursts of residual selling pressure on the tape.
Some resistance will emerge at the 50 twelve-hour simple moving average (SMA) at $77.34. Still, more substantial resistance for Ethereum Classic price is at the declining trend line beginning on May 7, currently at $98.20 and, of course, $100.00.
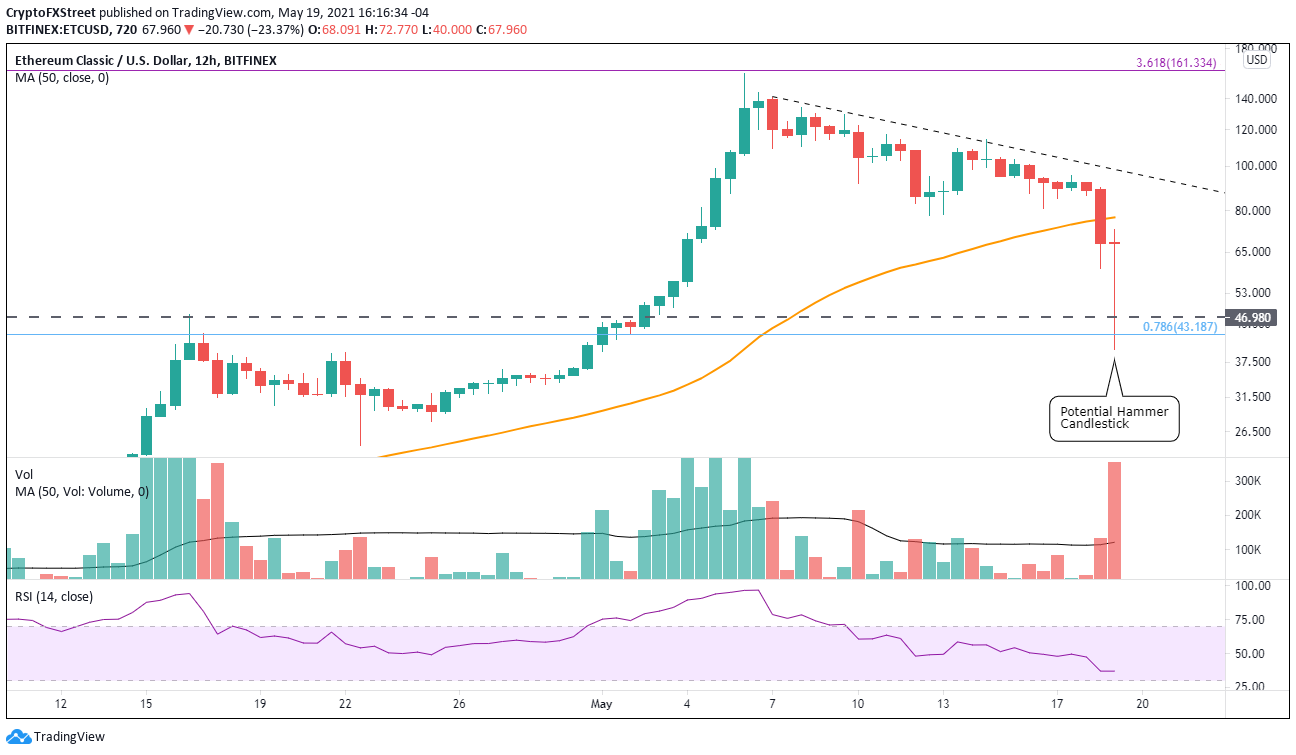
ETC/USD 12-hour chart
A reversal of today’s bounce doesn’t have any precise support levels until a range framed by the 50-day SMA at $50.75, the 2018 high at $46.98, the 78.6% retracement at $43.18 and today’s low at $40.00.
Author

Sheldon McIntyre, CMT
Independent Analyst
Sheldon has 24 years of investment experience holding various positions in companies based in the United States and Chile. His core competencies include BRIC and G-10 equity markets, swing and position trading and technical analysis.