ETH/USD technical analysis: Ethereum breaks higher to near breakeven for the session
- Ethereum moves higher as a bout of buying volume comes in.
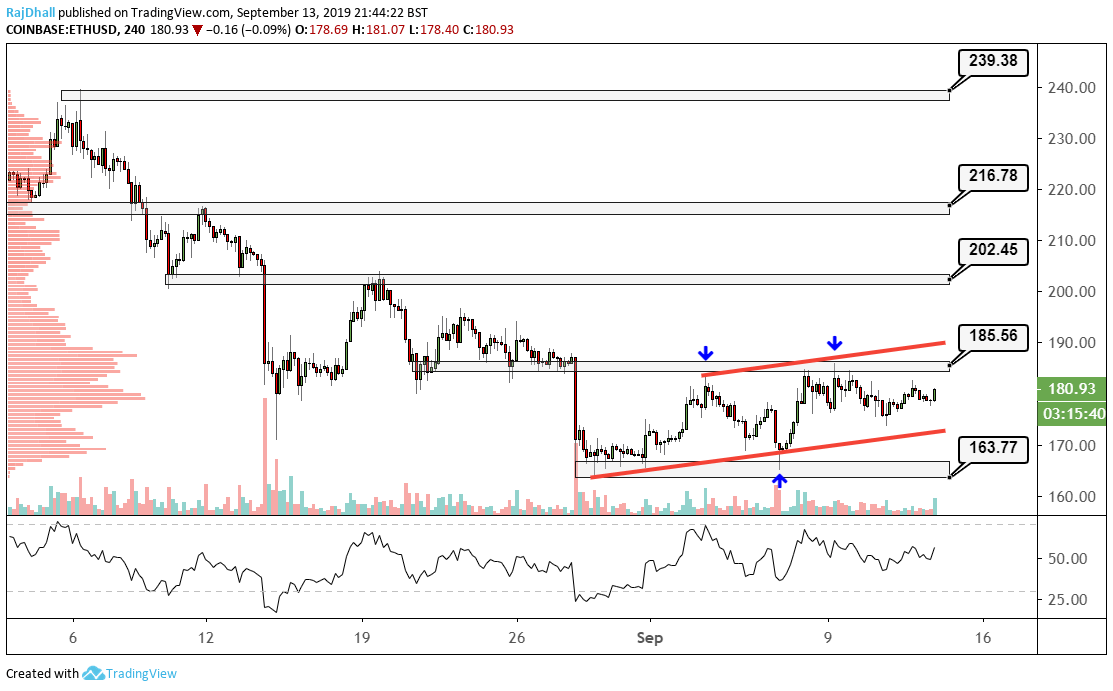
- The current chart pattern indicates the move will continue with the next resistance at 185.56.

After rejecting 163 last week, the price has now moved away from its base formation to make a few consecutive higher lows and higher highs.
Price is moving toward the next resistance at 185.56, the level used as a resistance a few times over the last month.
It has been quite the downtrend, and a move from 240 to near 160 is a big drop. After this sideways move let's see if ETH/USD can move higher.
The last four-hour candle was a hammer and indicated a move higher. We need to see how this candle closes but the momentum and volume right now look strong.
On the daily chart, the RSI (Relative Strength Index) is showing a hidden divergence so that is another major positive sign.
Author

Rajan Dhall, MSTA
FX Daily
Rajan Dhall is an experienced market analyst, who has been trading professionally since 2007 managing various funds producing exceptional returns.


